September 2019 Market Report

Sevier County Homes

1600 homes sold in Sevier County during January and September of 2019.
1589 homes sold during January and August of 2018.
Sales are up 1%.
Average price has increased by 10% and is up by $26,000.
Average price is $283,467.
Available Inventory is down 6%, and Volume up by 11%.

Gatlinburg

254 homes sold in Gatlinburg during January and September of 2019.
256 homes sold during January and August of 2018.
Sales are down by 1%.
Average price has increased by 16% and is up by $39,000.
Average price is $294,461.
Available Inventory is down 14%, and Volume is up 4%.

Pigeon Forge

270 homes sold in Pigeon Forge during January and September of 2019.
303 homes sold during January and August of 2018.
Sales are down by 11%.
Average price has increased by 22% and is up by $62,000.
Average price is $346,731.
Available Inventory is down 5%, and Volume up by 9%.
*7 homes have been sold for over $1M in Pigeon Forge this year. 

Sevierville

491 homes sold in Sevierville during January and September of 2019.
477 homes sold during January and August of 2018.
Sales are up by 3%.
Average price is up by 1%.
Average price is $254,928.
Available Inventory is down 4%,  and Volume up 4%.

Wears Valley

88 homes sold in Wears Valley during January and September of 2019.
106 homes sold during January and August of 2018.
Sales are down by 17%.
Average price has increased by 15% and is up by $45,000.
Average price is $356,341.
Available Inventory is down 12%, and Volume down by 5%.

Douglas Lake

52 homes sold on Douglas Lake during January and September of 2019.
49 homes sold during January and August of 2018.
Sales are up 6%.
Average price has increased by 17% and is up by $47,000.
Average price is $327,275.
Available Inventory is down 6%, and Volume up 24%
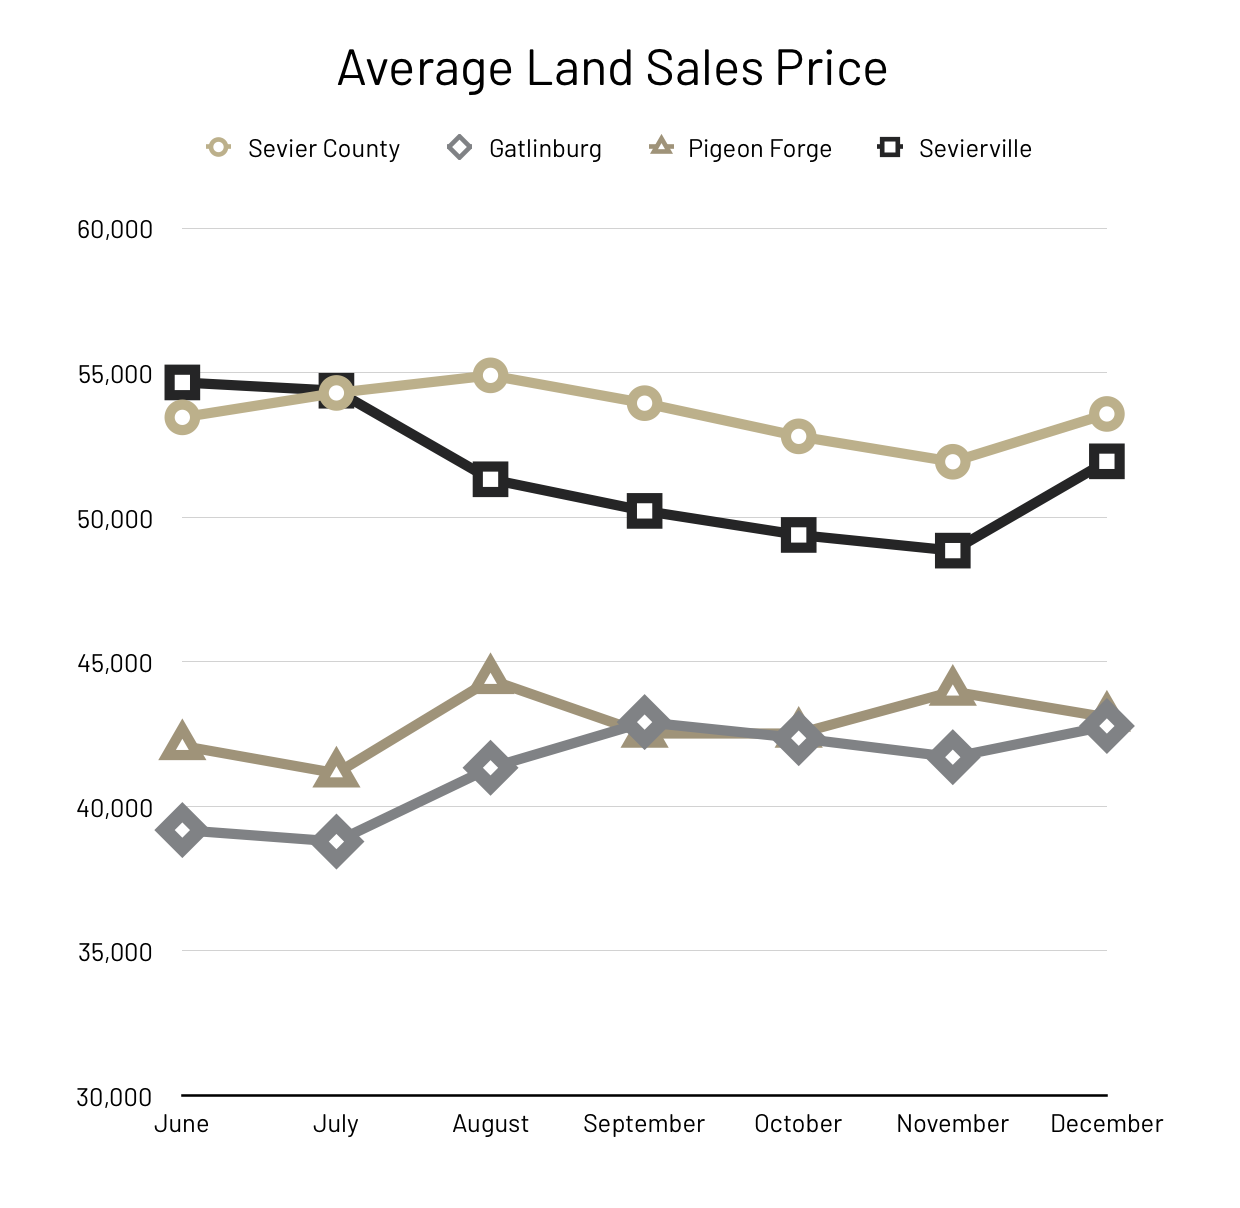
Sevier County Lots

491 lots sold in Sevier County during January and September of 2019.
413 lots sold during January and August of 2018.
Sales are up by 19%.
Average price has increased by 15% and is up by $8,000.
Average price is $62,115.
Available Inventory is down 9%, but Volume up by 37%.

Gatlinburg

128 lots sold in Gatlinburg during January and September of 2019.
76 lots sold during January and August of 2018.
Sales are up by 68%.
Average price has increased by 27% and is up by $11,000.
Average price is $54,570.
Available Inventory is down 1%, and Volume up by 144%.

Chalet Village

39 lots sold in Chalet Village during January and September of 2019.
29 lots sold during January and August of 2018.
Sales are up by 34%.
Average price is up by 4% and is up by $1,000.
Average price is $56,814.
Available Inventory is flat, and Volume up 39%.

Pigeon Forge

54 lots sold in Pigeon Forge during January and September of 2019.
51 lots sold during January and August of 2018.
Sales are up 6%.
Average price has increased by 41% and is up by $17,000.
Average price is $60,047.
Available Inventory is down 18%, and Volume up by 50%.

August 2019 Market Report for Sevier County

Sevier County Homes

1434 homes sold in Sevier County during January and August of 2019.
1433 homes sold during January and August of 2018.
Sales are flat.
Average price has increased by 11% and is up by $28,000.
Average price is $282,964.
Available Inventory is down 7%, and Volume up by 11%.

Gatlinburg

223 homes sold in Gatlinburg during January and August of 2019.
244 homes sold during January and August of 2018.
Sales are down by 9%.
Average price has increased by 14% and is up by $36,000.
Average price is $291,324.
Available Inventory is down 14%, and Volume is up 4%.

Pigeon Forge

242 homes sold in Pigeon Forge during January and August of 2019.
273 homes sold during January and August of 2018.
Sales are down by 11%.
Average price has increased by 23% and is up by $63,000.
Average price is $342,976.
Available Inventory is down 5%, and Volume up by 9%.
*7 homes have been sold for over $1M in Pigeon Forge this year. 

Sevierville

443 homes sold in Sevierville during January and August of 2019.
422 homes sold during January and August of 2018.
Sales are up by 5%.
Average price is up by 3%.
Average price is $255,226.
Available Inventory is down 4%,  and Volume up 8%.

Wears Valley

80 homes sold in Wears Valley during January and August of 2019.
95 homes sold during January and August of 2018.
Sales are down by 16%.
Average price has increased by 17% and is up by $52,000.
Average price is $358,988.
Available Inventory is down 14%, and Volume down by 1%.

Douglas Lake

48 homes sold on Douglas Lake during January and August of 2019.
44 homes sold during January and August of 2018.
Sales are up 9%.
Average price has increased by 15% and is up by $42,000.
Average price is $318,444.
Available Inventory is down 5%,  and Volume up 26%

August 2019 Market Report for Sevier County, TN - Land

Sevier County Lots

451 lots sold in Sevier County during January and August of 2019.
366 lots sold during January and August of 2018.
Sales are up by 23%.
Average price has increased by 13% and is up by $7,000.
Average price is $62,169.
Available Inventory is down 9%, but Volume up by 40%.

Gatlinburg

123 lots sold in Gatlinburg during January and August of 2019.
67 lots sold during January and August of 2018.
Sales are up by 84%.
Average price has increased by 33% and is up by $13,000.
Average price is $55,065.
Available Inventory is down 2%, and Volume up by 145%.

Chalet Village

37 lots sold in Chalet Village during January and August of 2019.
28 lots sold during January and August of 2018.
Sales are up by 32%.
Average price is up down by 6% and is down by $3,000.
Average price is $52,590.
Available Inventory is up 1%, and Volume up 24%.

Pigeon Forge

52 lots sold in Pigeon Forge during January and August of 2019.
48 lots sold during January and August of 2018.
Sales are up 8%.
Average price has increased by 37% and is up by $16,000.
Average price is $60,722.
Available Inventory is down 19%, and Volume up by 48%.

July 2019 Market Report

Sevier County Homes

1215 homes sold in Sevier County during January and July of 2019.
1231 homes sold during January and July of 2018.
Sales are down 1%.
Average price has increased by 12% and is up by $30,000.
Average price is $278,973.
Available Inventory is down 9%, and Volume up by 10%.

Gatlinburg

189 homes sold in Gatlinburg during January and July of 2019.
212 homes sold during January and July of 2018.
Sales are down by 11%.
Average price has increased by 15% and is up by $36,000.
Average price is $285,234.
Available Inventory is down 16%, and Volume is up 2%.

Pigeon Forge

200 homes sold in Pigeon Forge during January and July of 2019.
237 homes sold during January and July of 2018.
Sales are down by 16%.
Average price has increased by 25% and is up by $68,000.
Average price is $340,927.
Available Inventory is down 10%, and Volume up by 6%.
*6 homes have been sold for over $1M in Pigeon Forge this year. 

Sevierville

384 homes sold in Sevierville during January and July of 2019.
366 homes sold during January and July of 2018.
Sales are up by 5%.
Average price is up by 3%.
Average price is $256,367.
Available Inventory is down 6%,  and Volume up 8%.

Wears Valley

64 homes sold in Wears Valley during January and July of 2019.
75 homes sold during January and July of 2018.
Sales are down by 15%.
Average price has increased by 21% and is up by $64,000.
Average price is $363,445.
Available Inventory is down 15%, and Volume up 4%.

Douglas Lake

36 homes sold in Douglas Lake during January and July of 2019.29 homes sold during January and July of 2018.
Sales are up 24%.
Average price has increased by 10% and is up by $25,000.
Average price is $271,773.
Available Inventory is down 4%,  and Volume up 37%

Sevier County Lots

391 lots sold in Sevier County during January and July of 2019.
324 lots sold during January and July of 2018.
Sales are up by 21%.
Average price has increased by 12% and is up by $6,000.
Average price is $60,783.
Available Inventory is down 11%, but Volume up by 35%.

Gatlinburg

106 lots sold in Gatlinburg during January and July of 2019.
62 lots sold during January and July of 2018.
Sales are up by 71%.
Average price has increased by 44% and is up by $17,000.
Average price is $55,889.
Available Inventory is down 3%, and Volume up by 146%.

Chalet Village

36 lots sold in Chalet Village during January and July of 2019.
21 lots sold during January and July of 2018.
Sales are up by 71%.
Average price is up by 4%
Average price is $53,245.
Available Inventory is up 7%, and Volume up 79%.

Pigeon Forge

48 lots sold in Pigeon Forge during January and July of 2019.
45 lots sold during January and July of 2018.
Sales are up 7%.
Average price has increased by 53% and is up by $21,999.
Average price is $63,147.
Available Inventory is down 20%, and Volume up by 64%.

Market Report for Sevier County – June 2019

Market Report for Sevier County, TN in June 2019

Sevier County Homes

1036 homes sold in Sevier County during January and June of 2019.
1049 homes sold during January and June of 2018.
Sales are down 1%.
Average price has increased by 12% and is up by $29,000.
Average price is $280,374.
Available Inventory is down 10%, and Volume up by 10%.

Gatlinburg

157 homes sold in Gatlinburg during January and June of 2019.
181 homes sold during January and June of 2018.
Sales are down by 13%.
Average price has increased by 15% and is up by $38,000.
Average price is $286,291.
Available Inventory is down 20%, and Volume flat.

Pigeon Forge

179 homes sold in Pigeon Forge during January and June of 2019.
203 homes sold during January and June of 2018.
Sales are down by 12%.
Average price has increased by 8% and is up by $18,000.
Average price is $248,500.
Available Inventory is down 12%, and Volume up by 12%.

Sevierville

322 homes sold in Sevierville during January and June of 2019.
323 homes sold during January and June of 2018.
Sales are flat.
Average price is up by 2%.
Average price is $255,817.
Available Inventory is down 6%,  and Volume up 1%.

Wears Valley

58 homes sold in Wears Valley during January and June of 2019.
65 homes sold during January and June of 2018.
Sales are down by 11%.
Average price has increased by 26% and is up by $75,000.
Average price is $367,733.
Available Inventory is down 18%, and Volume up 12%.

Douglas Lake

30 homes sold in Wears Valley during January and June of 2019.
22 homes sold during January and June of 2018.
Sales are up 36%.
Average price has increased by 37% and is up by $77,000.
Average price is $286,053.
Available Inventory is down 1%,  and Volume up 96%

Sevier County Lots

325 lots sold in Sevier County during January and June of 2019.
285 lots sold during January and June of 2018.
Sales are up by 14%.
Average price has increased by 12% and is up by $6,000.
Average price is $60,089.
Available Inventory is down 12%, but Volume up by 28%.

Gatlinburg

89 lots sold in Gatlinburg during January and June of 2019.
56 lots sold during January and June of 2018.
Sales are up by 59%.
Average price has increased by 43% and is up by $17,000.
Average price is $56,226.
Available Inventory is down 2%, and Volume up by 128%.

Chalet Village

29 lots sold in Chalet Village during January and June of 2019.
19 lots sold during January and June of 2018.
Sales are up by 53%.
Average price is up by 1%
Average price is $51,412.
Available Inventory is up 1%, and Volume up 54%.

Pigeon Forge

41 lots sold in Pigeon Forge during January and June of 2019.
39 lots sold during January and June of 2018.
Sales are up 5%.
Average price has increased by 53% and is up by $22,163.
Average price is $64,257.
Available Inventory is down 17%, and Volume up by 60%.

Sevier County Market Report for May 2019

Sevier County Homes

850 homes sold in Sevier County during January and May of 2019.
848 homes sold during January and May of 2018.
Sales are flat.
Average price has increased by 11% and is up by $26,000.
Average price is $277,790.
Available Inventory is down 10%, and Volume up by 11%.

Gatlinburg

115 homes sold in Gatlinburg during January and May of 2019.
150 homes sold during January and May of 2018.
Sales are down by 23%.
Average price has increased by 14% and is up by $34,000.
Average price is $278,007.
Available Inventory is down 18%, and Volume down by 12%.

Pigeon Forge

165 homes sold in Pigeon Forge during January and May of 2019.
171 homes sold during January and May of 2018.
Sales are down by 4%.
Average price has increased by 22% and is up by $62,000.
Average price is $342,288.
Available Inventory is down 13%, and Volume up by 18%.

Sevierville

263 homes sold in Sevierville during January and May of 2019.
272 homes sold during January and May of 2018.
Sales are down by 3%.
Average price is up by 1%.
Average price is $254,561.
Available Inventory is down 5%,  and Volume down 2%.

Wears Valley

49 homes sold in Wears Valley during January and May of 2019.
47 homes sold during January and May of 2018.
Sales are up by 4%.
Average price has increased by 21% and is up by $62,000.
Average price is $359,997.
Available Inventory is down 14%, and Volume up 26%.

Douglas Lake

23 homes sold in Wears Valley during January and May of 2019.
16 homes sold during January and May of 2018.
Sales are up 44%.
Average price has increased by 37% and is up by $73,000.
Average price is $273,552.
Available Inventory is down 1%,  and Volume up 96%

Sevier County Lots

265 lots sold in Sevier County during January and May of 2019.
239 lots sold during January and May of 2018.
Sales are up by 11%.
Average price has increased by 101% and is up by $49,000.
Average price is $98,879.
Available Inventory is down 12%, but Volume up by 123%.
*

Gatlinburg

71 lots sold in Gatlinburg during January and May of 2019.
45 lots sold during January and May of 2018.
Sales are up by 58%.
Average price has increased by 25% and is up by $9,000.
Average price is $49,067.
Available Inventory is down 3%, and Volume up by 98%.

Chalet Village

20 lots sold in Chalet Village during January and May of 2019.
16 lots sold during January and May of 2018.
Sales are up by 25%.
Average price is down by 3%
Average price is $49,147.
Available Inventory is down 12%, and Volume up 22%.

Pigeon Forge

38 lots sold in Pigeon Forge during January and May of 2019.
32 lots sold during January and May of 2018.
Sales are up 19%.
Average price has increased by 24% and is up by $10,519.
Average price is $54,462.
Available Inventory is down 20%, and Volume up by 47%.

Sevier County Market Statistics – April 2019

Sevier County Homes

652 homes sold in Sevier County during January and March of 2019.
668 homes sold during January and March of 2018.
Sales are down by 2%.
Average price has increased by 14% and is up by $32,000.
Average price is $274,231.
Available Inventory is down 11%, and Volume up by 11%.

Gatlinburg

90 homes sold in Gatlinburg during January and March of 2019.
116 homes sold during January and March of 2018.
Sales are down by 22%.
Average price has increased by 22% and is up by $49,000.
Average price is $280,917.
Available Inventory is down 24%, and Volume down by 6%.

Pigeon Forge

137 homes sold in Pigeon Forge during January and March of 2019.
139 homes sold during January and March of 2018.
Sales are down by 1%.
Average price has increased by 23% and is up by $63,000.
Average price is $332,301.
Available Inventory is down 15%, and Volume up by 22%.

Sevierville

194 homes sold in Sevierville during January and March of 2019.
210 homes sold during January and March of 2018.
Sales are down by 8%.
Average price is up by 2%.
Average price is $245,272.
Available Inventory is down 8%,  and Volume down 6%.

Wears Valley

36 homes sold in Wears Valley during January and March of 2019.
38 homes sold during January and March of 2018.
Sales are down by 7%.
Average price has increased by 19% and is up by $56,000.
Average price is $349,322.
Available Inventory is down 16%,  and Volume up 13%.

Douglas Lake

16 homes sold in Wears Valley during January and March of 2019.
14 homes sold during January and March of 2018.
Sales are up 14%.
Average price has increased by 36% and is up by $75,000.
Average price is $287,056.
Available Inventory is up 4%,  and Volume up 55%

Sevier County Lots

187 lots sold in Sevier County during January and March of 2019.
184 lots sold during January and March of 2018.
Sales are up by 2%.
Average price has increased by 23% and is up by $10,000.
Average price is $58,125.
Available Inventory is down 13%, but Volume up by 25%.

Gatlinburg

47 lots sold in Gatlinburg during January and March of 2019.
35 lots sold during January and March of 2018.
Sales are up by 34%.
Average price has increased by 49% and is up by $17,000.
Average price is $53,704.
Available Inventory is down 3%, and Volume up by 100%.

Chalet Village

14 lots sold in Chalet Village during January and March of 2019.
15 lots sold during January and March of 2018.
Sales are down 7%.
Average price is down by 10%
Average price is $46,210.
Available Inventory is down 14%,  and Volume down 16%.

Pigeon Forge

28 lots sold in Pigeon Forge during January and March of 2019.
14 lots sold during January and March of 2018.
Sales are up 100%.
Average price has increased by 17% and is up by $47,046.
Average price is $47,046.
Available Inventory is down 16%, and Volume up by 134%.

February 2019 Market Report for Sevier County

February Market Report Homes for Sevier County

Sevier County Homes

275 homes sold in Sevier County during January and February of 2019.
276 homes sold during January and February of 2018.
Sales are flat.
Average price has increased by 24% and is up by $54,000.
Average price is $278,808.
Available Inventory is down 15%, but Volume up by 24%.

Gatlinburg

39 homes sold in Gatlinburg during January and February of 2019.
56 homes sold during January and February of 2018.
Sales are down by 30%.
Average price has increased by 43% and is up by $85,000.
Average price is $284,791.
Available Inventory is down 26%, and Volume down by 1%.

Pigeon Forge

56 homes sold in Pigeon Forge during January and February of 2019.
53 homes sold during January and February of 2018.
Sales are up 6%.
Average price has increased by 49% and is up by $119,000.
Average price is $365,167.
Available Inventory is down 23%, and Volume up by 57%.

Sevierville

84 homes sold in Sevierville during January and February of 2019.
78 homes sold during January and February of 2018.
Sales are up 8%.
Average price is flat to last year.
Average price is $235,781.
Available Inventory is down 11%,  and Volume up 8%.

Wears Valley

16 homes sold in Wears Valley during January and February of 2019.
15 homes sold during January and February of 2018.
Sales are up 7%.
Average price has increased by 13% and is up by $54,000.
Average price is $317,618.
Available Inventory is down 26%,  and Volume up 20%.

Douglas Lake

7 homes sold in Wears Valley during January and February of 2019.
7 homes sold during January and February of 2018.
Sales are flat to last year.
Average price has increased by 43% and is up by $72,000.
Average price is $239,857.
Available Inventory is up 4%,  and Volume up 43%.

market report for land in sevier county

Sevier County Lots

89 lots sold in Sevier County during January and February of 2019.
85 lots sold during January and February of 2018.
Sales are up by 5%.
Average price has increased by 10% and is up by $5,000.
Average price is $60,175.
Available Inventory is down 12%, but Volume up by 16%.

Gatlinburg

23 lots sold in Gatlinburg during January and February of 2019.
11 lots sold during January and February of 2018.
Sales are up by 92%.
Average price has decreased by 17% and is down by $8,000..
Average price is $43,173..
Available Inventory is up 3%, and Volume up by 59%.

Chalet Village

9 lots sold in Chalet Village during January and February of 2019.
10 lots sold during January and February of 2018.
Sales are down 10%.
Average price is down by 5%
Average price is $46,827.
Available Inventory is down 33%,  and Volume down 14%.

Pigeon Forge

14 lots sold in Pigeon Forge during January and February of 2019.
6 lots sold during January and February of 2018.
Sales are up 133%.
Average price has decreased by 60% and is down by $35,000..
Average price is $23,172.
Available Inventory is down 20%, and Volume down by 7%.

January 2019 Market Report

Sevier County Market Report for January 2019

January 2019 Market Report Homes


Sevier County Homes

129 homes sold in Sevier County in January of 2019.
145 homes sold in January of 2018.
Sales are down 11%.
Average price has increased by 26% and is up by $61,000.
Average price is $290,560.
Available Inventory is down 17%, but Volume up by 13%.

Gatlinburg

17 homes sold in Gatlinburg in January of 2019.
28 homes sold in January of 2018.
Sales are down by 39%.
Average price has increased by 49% and is up by $105,000.
Average price is $319,279.
Available Inventory is down 33%, and Volume down by 9%.

Pigeon Forge

26 homes sold in Pigeon Forge in January of 2019.
29 homes sold in January of 2018.
Sales are down 10%.
Average price has increased by 61% and is up by $147,000.
Average price is $389,310.
Available Inventory is down 32%, and Volume up by 44%.

Sevierville

37 homes sold in Sevierville in January of 2019.
39 homes sold in January of 2018.
Sales are down 5%.
Average price has increased by 6% and is up by $13,000.
Average price is $248,629.
Available Inventory is down 10%,  and Volume is flat.

Douglas Lake

3 homes sold on Douglas Lake in January of 2019.
6 homes sold in January of 2018.
Sales are down 50%.
Average price has increased by 11%, and is up by $17,000.
Average price is $183,333.
Available Inventory is up 2%, and Volume down by 45%.

Wears Valley

7 homes sold in Wears Valley in January of 2019.
10 homes sold in January of 2018.
Sales are down 30%.
Average price has decreased by 1% and is down by $4,000.
Average price is $300,142.
Available Inventory is down 27%, and Volume down by 31%.

Seymour

8 homes sold in Seymour in January of 2019.
10 homes sold in January of 2018.
Sales are down by 20%.
Average price has increased by 36% and is up by $70,000.
Average price is $266,137.
Available Inventory is up 5%, and Volume up by 9%


January 2019 Market Report - Lots


Sevier County Lots

34 lots sold in Sevier County in January of 2019.
32 lots sold in January of 2018.
Sales are up by 6%.
Average price has increased by 15% and is up by $10,000.
Average price is $78,947.
Available Inventory is down 14%, and Volume up by 22%.

Gatlinburg

8 lots sold in Gatlinburg in January of 2019.
5 lots sold in January of 2018.
Sales are up 60%.
Average price has decreased by 9% and is down by $2,000.
Average price is $25,062.
Available Inventory is down by 2%, and Volume up by 46%.

Chalet Village

4 lots sold in Chalet Village in January of 2019.
3 lots sold in January of 2018.
Sales are up 33%.
Average price has increased by 31% and is up by $49,000.
Average price is $52,475.
Available Inventory is down by 28%, and Volume up by 31%.

Pigeon Forge

1 lots sold in Pigeon Forge in January of 2019.
2 lots sold in January of 2018.
Sales are down by 50%.
Average price has decreased by 41% and is down by $37,000.
Average price is $55,000.
Available Inventory is down 16%, and Volume down by 70%.

Sevierville

6 lots sold in Sevierville in January of 2019.
9 lots sold in January of 2018.
Sales are down by 33%.
Average price has increased by 402% and is up by $109,000.
Average price is $238,333.
Available Inventory is down by 7%, and Volume up by 235%.
* A 90 acre lot sold for $914,000 this month.

Douglas Lake

No lots were sold on Douglas lake this month. 

Wears Valley

3 lots sold in Wears Valley in January of 2019.
2 lots sold in January of 2018.
Sales are down 50%.
Average price has increased by 19% and is up by $9,000.
Average price is $56,000.
Available Inventory is down 28%, and Volume up by 79%

You can find previous Market Reports here.

Home Inspection FAQ

After choosing your new home it is now time to take a look at the inner workings.

Insight Home Inspection Services, LLC


What is a home inspection?
A home inspection is an objective visual examination of the physical structure and systems of a house, from the roof to the foundation.

What does a home inspection include?
The standard home inspection report will cover the condition of the home’s heating system, central air conditioning system, interior plumbing and electrical systems, the roof, attic and visible insulation, walls, ceilings, floors, windows and doors, the foundation, basement / crawlspace and structural components.

The American Society of Home Inspectors (ASHI) publishes a Standards of Practice and Code of Ethics that outlines what you should expect to be covered in your home inspection report.

Why do I need a home inspection?
Buying a home could be the largest single investment you will ever make. To minimize unpleasant surprises and unexpected difficulties, you’ll want to learn as much as you can about the newly constructed or existing house before you buy it. A home inspection may identify the need for major repairs or builder oversights, as well as the need for maintenance to keep it in good shape. After the inspection, you will know more about the house, which will allow you to make decisions with confidence.

If you already are a homeowner, a home inspection can identify problems in the making and suggest preventive measures that might help you avoid costly future repairs.

If you are planning to sell your home, a home inspection can give you the opportunity to make repairs that will put the house in better selling condition.


Below are a few examples of common issues to beware of:


Foundation Cracks


Foundations cracks are generally a result of soil conditions. Some soils are affected differently  by moisture and or dry conditions which cause expansion or shrinking that will create an uplifting or lowering of the foundation footing and walls. Some obvious results of these factors are: crooked doorways, cracked or bowing walls, uneven floors and believe it or not even unusual smells and humidity. These smells are due to air passing through cracks from under the earth and the humidity is elevated due to soil moisture.


Termites when not detected and eliminated cause billions of dollars in damage every year. Termites can cause major structural damage that cannot be seen without proper training. In our area (Tennessee) we are battling subterranean termites. These termites travel through shelter / mud tubes which consist of soil and wood cemented together with saliva and feces. Subterranean termites cause more damage to homes in the U.S. than storms and fire combined.


Leaks/Mold


Leaks and moisture entry at any location can cause wood rot and mold. Mold when not detected can grow to the point of a severe health hazard. There are several different types of mold but the worst is Stachybotrys (black mold). Symptoms of black mold can be: coughing, itchy skin, sore throat, nosebleeds and much more. An in-depth inspection uses state of the art infrared cameras and moisture detecting devices that assist in locating temperature differentials and state of the art air quality testing machines that will gather air samples into a cartridge that is sent to a third party lab for evaluation. An air quality report can assist your doctor in determining possible health issues derived from mold related conditions.


Electrical Panel


It is important to have a properly wired house to prevent electrical shock and make sure we have power to plug in all of our electronics. But, did you know that an improper ground can damage our new phones, tablets, game consoles and much more? An in-depth inspection will bring these issues to light by way of removing the breaker panel cover, evaluating main and branch wiring, testing receptacles and ensuring that a proper sized supply is in place.

Thank you, Mark for providing this valuable information for us!
Follow Mark on Facebook here.


December Market Report for Sevier County

December Market Report for Sevier County

Sevier County Homes

December Market Report for Sevier County


2061 homes sold in Sevier County from January to December in 2018.
2177 homes sold in 2017.
Sales are down 5%.
Average price has increased by 10% and is up by $24,000.
Average price is $258,537.
Available Inventory is down 11%, but Volume up by 4%.

Check out the average price over the last half of the year!

Sevier County Homes Average Price

Gatlinburg

344 homes sold in Gatlinburg from January to December in 2018.
306 homes sold in 2017.
Sales are up by 12%.
Average price has increased by 12% and is up by $26,000.
Average price is $257,459.
Available Inventory is down 2%, and Volume up by 25%.

Pigeon Forge

389 homes sold in Pigeon Forge from January to December in 2018.
395 homes sold in 2017.
Sales are down 2%.
Average price has increased by 16% and is up by $40,000.
Average price is $288,024.
Available Inventory is down 17%, and Volume up by 15%.

Sevierville

606 homes sold in Sevierville from January to December in 2018.
641 homes sold in 2017.
Sales are down 5%.
Average price has increased by 13% and is up by $28,000.
Average price is $250,691.
Available Inventory is down 13%,  and Volume up by 7%.

Douglas Lake

59 homes sold on Douglas Lake from January to December in 2018.
64 homes sold in 2017.
Sales are down 8%.
Average price has increased by 6%, and is up by $17,000.
Average price is $310,672.
Available Inventory is down 9%, and Volume down by 2%.

Wears Valley

139 homes sold in Wears Valley from January to December in 2018.
177 homes sold in 2017.
Sales are down 21%.
Average price has increased by 11% and is up by $31,000.
Average price is $313,807.
Available Inventory is down 23%, and Volume down by 1%.

Sevier County Lots

December Market Report for Sevier County Lots


557 lots sold in Sevier County from January to December in 2018.
540 lots sold in 2017.
Sales are up by 3%.
Average price has decreased by 14% and is down by $8,000.
Average price is $53,578.
Available Inventory is down 3%, and Volume down by 11%.

Check out the average price over the last half of the year!

December Market Report for Land

Gatlinburg

108 lots sold in Gatlinburg from January to December in 2018.
119 lots sold in 2017.
Sales are down 9%.
Average price has increased by 4% and is up by $1,000.
Average price is $42,783.
Available Inventory is up by 7%, and Volume down by 5%.

Chalet Village

41 lots sold in Chalet Village from January to December in 2018.
35 lots sold in 2017.
Sales are up 17%.
Average price has increased by 6% and is up by $2,000.
Average price is $48,026.
Available Inventory is up by 5%, and Volume up by 25%.

Pigeon Forge

58 lots sold in Pigeon Forge from January to December in 2018.
49 lots sold in 2017.
Sales are up 18%.
Average price has decreased by 80% and is down by $171,000.
*Miller Way was closed for  $6M+ in December of 2017 and is an outlier to this data.
Average price is $43,081.
Available Inventory is down 2%, and Volume down by 76%.

Sevierville

128 lots sold in Sevierville from January to December in 2018.
119 lots sold in 2017.
Sales are up 8%.
Average price is flat to last year.
Average price is $51,939.
Available Inventory is down by 1%, and Volume up by 8%.

Douglas Lake

27 lots sold on Douglas Lake from January to December in 2018.
18 lots sold in 2017.
Sales are up 50%.
Average price has increased by 74% and is up by $48,000.
Average price is $112,607.
Available Inventory is up 1%, and Volume up by 161%.

Wears Valley

51 lots sold in Wears Valley from January to December in 2018.
61 lots sold in 2017.
Sales are down 16%.
Average price has increased by 49% and is up by $23,000.
Average price is $72,390.
Available Inventory is down 10%, and Volume up by 25%

You can find previous Market Reports here.