
Bedroom count is one of the most commonly used filters in real estate searches, but by itself it doesn’t explain how the market behaves. When we group sold listings by bedroom count, clear differences emerge in sales volume, pricing, time on market, and rental performance.
These differences describe how, if at all, predictable outcomes are at different sizes.
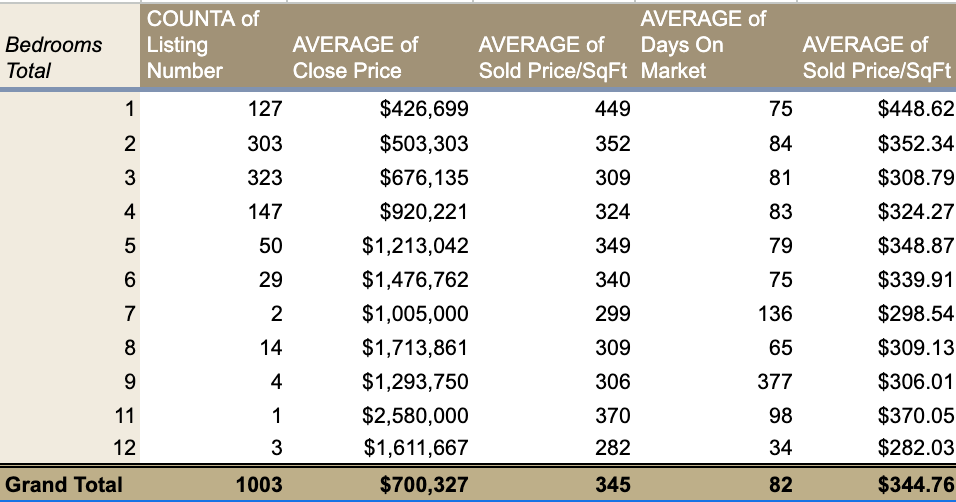
Sales volume was strongest in the 2–3 bedroom range, which accounted for the largest share of all closed listings.
Activity declined starting at four bedrooms and dropped more sharply as bedroom count increased beyond that point.
- 2–3 bedroom homes represented the largest segment of the market
- 4-bedroom homes continued to sell at a meaningful pace, but at less than half the volume of 2–3 bedroom homes
- 5+ bedroom homes made up a much smaller share of total transactions
- 7+ bedroom homes sold infrequently, often with only a handful of sales
How Bedroom Count Related to Time on Market
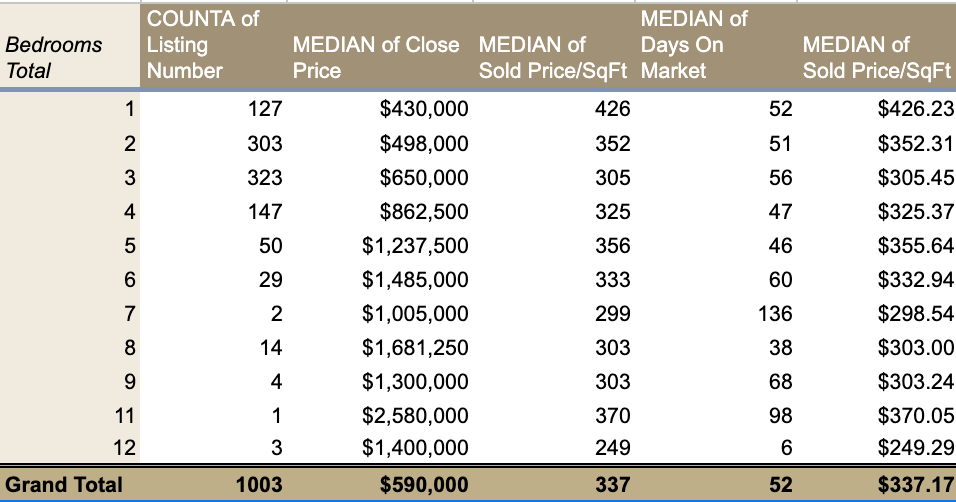
Median days on market remained relatively consistent through the mid-range bedroom counts.
- 1–4 bedroom homes clustered tightly around similar median timelines
- 5–6 bedroom homes showed modest increases in median days on market
- 7+ bedroom homes showed wide variation, including both very short and very long timelines
This indicates that outcomes become less consistent as bedroom count increases and sales volume decreases.
Price Per Square Foot Changes With Size
Price per square foot declined as bedroom count increased, even as total sale prices rose.
-
- Smaller homes consistently sold at higher price-per-square-foot levels
- Larger homes sold for higher total prices, but at lower price-per-square-foot levels
- Four- and five-bedroom homes often represented a midpoint where total price increased without the sharpest drop in price efficiency
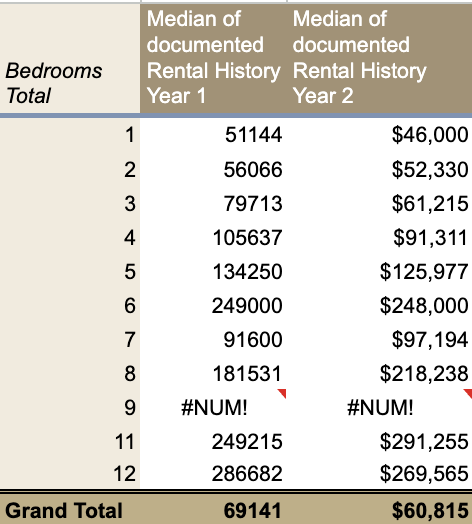
Rental Performance Scales With Increasing Variability
Documented rental history** increased as bedroom count increased through the mid-range.
-
- Median rental figures rose steadily from 1 to 6 bedrooms
- Six-bedroom homes showed a significant jump in median rental history
- Beyond six bedrooms, rental performance became uneven, with wide variation between properties
At higher bedroom counts, small sample sizes and property-specific factors had a greater impact on results. This makes category-level conclusions less reliable.

Why Medians Matter at Higher Bedroom Counts
Average figures widened significantly at larger bedroom counts.
- Days on market averages increased sharply due to a small number of long-running listings
- Rental averages were heavily influenced by individual properties
- One or two sales could materially change the averages for a category
For this reason, median figures provide a more stable view of typical performance, especially where sales volume is thin.
What Changes as Bedroom Count Increases
Based on the sold data:
- 2–4 bedrooms: highest liquidity and most consistent outcomes
- 5–6 bedrooms: higher upside with narrower margins for pricing and positioning errors
- 7+ bedrooms: outcomes become highly property-specific due to limited transaction volume
Bedroom count does not determine success on its own, but it changes how sensitive a property is to pricing, timing, and individual characteristics.
Understanding where a property falls within these ranges helps set expectations for pricing strategy, timelines, and risk.
*Areas included in statistics are Bluff Mountain, Chalet Village, Cobbly Nob, Douglas Lake, Gatlinburg, Jones Cove, Kodak, New Center, Pigeon Forge, Pittman Center, Sevierville, Seymour, and Wears Valley. Includes Only properties that can be used as a short term rentals.
**This data is pulled from the GSM MLS. Not all properties that are rentals have documented rental income inside the MLS.