Homes

Average price was $679,333 during the month of May, which is a slight reduction from April at $693,604.
This is quite a bit lower than May of 2023, where average price sat at $748,216.
January 2024 – $685,047
February 2024 – $689,422
March 2024 – $926,103
April 2024 – $693,604
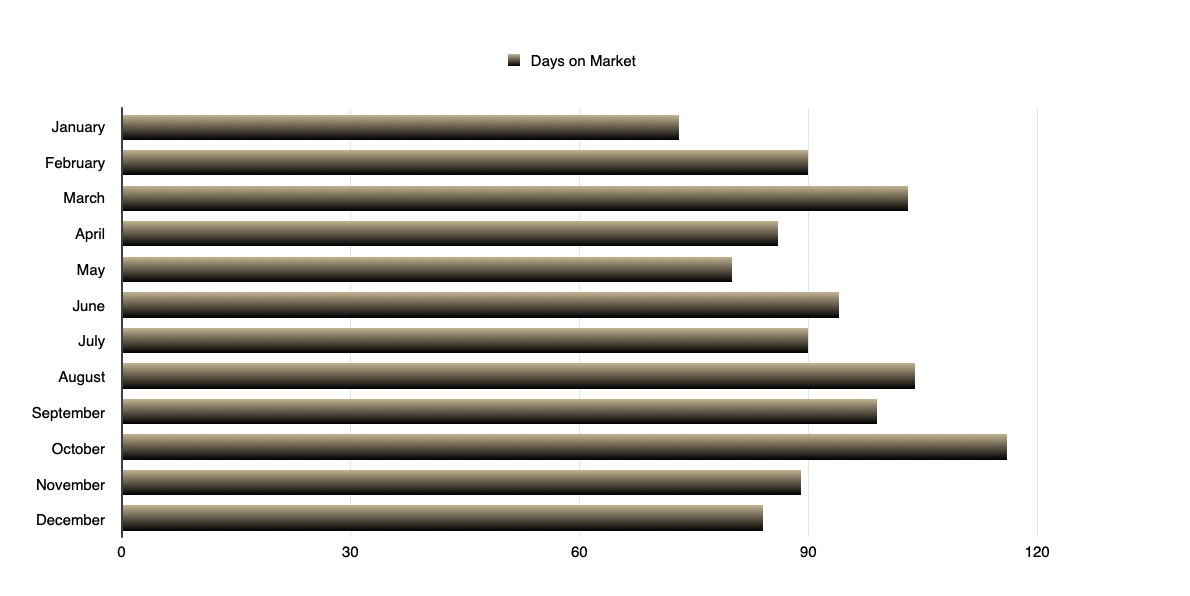
Days on market during the month of May was 100, which is an increase from April at 80 days on the market.
This month had the highest days on market that we’ve seen this year.
January 2024 – 82
February 2024 – 64
March 2024 – 46
April 2024 – 80
Price per square foot saw a slight reduction again to $380, from $382 in April and $386 in March.

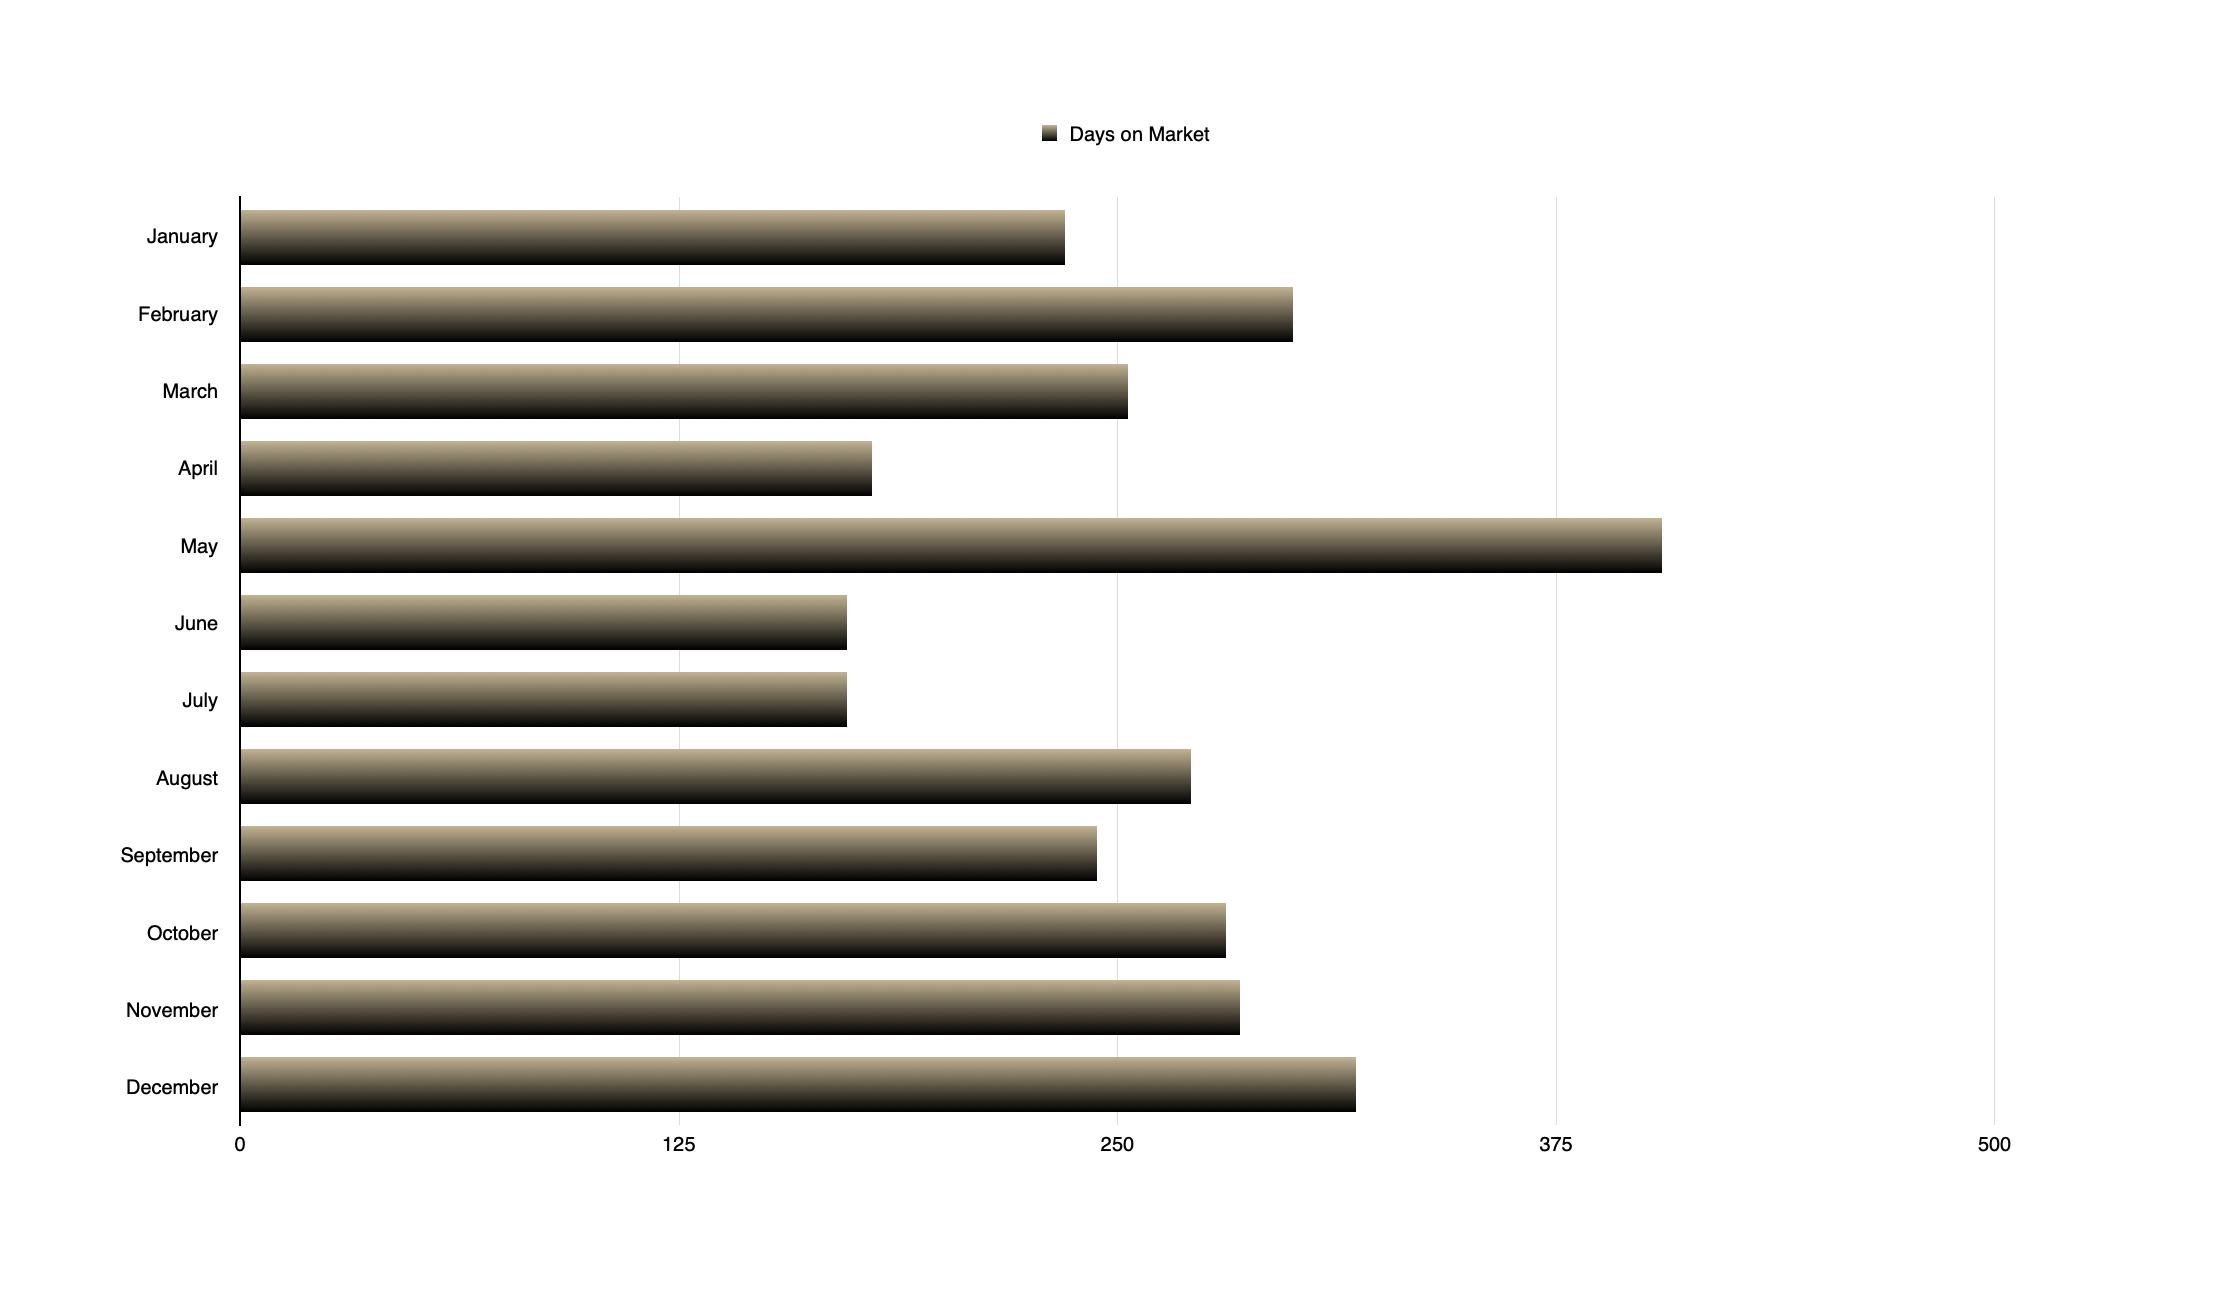
Land

The average price for land/lots during May was $125,017, up slightly drom $113,316 in May 2023.
Lots that sold in May spent an average for 126 days on market, up 45% from May 2023 at 87 days.