
Residential
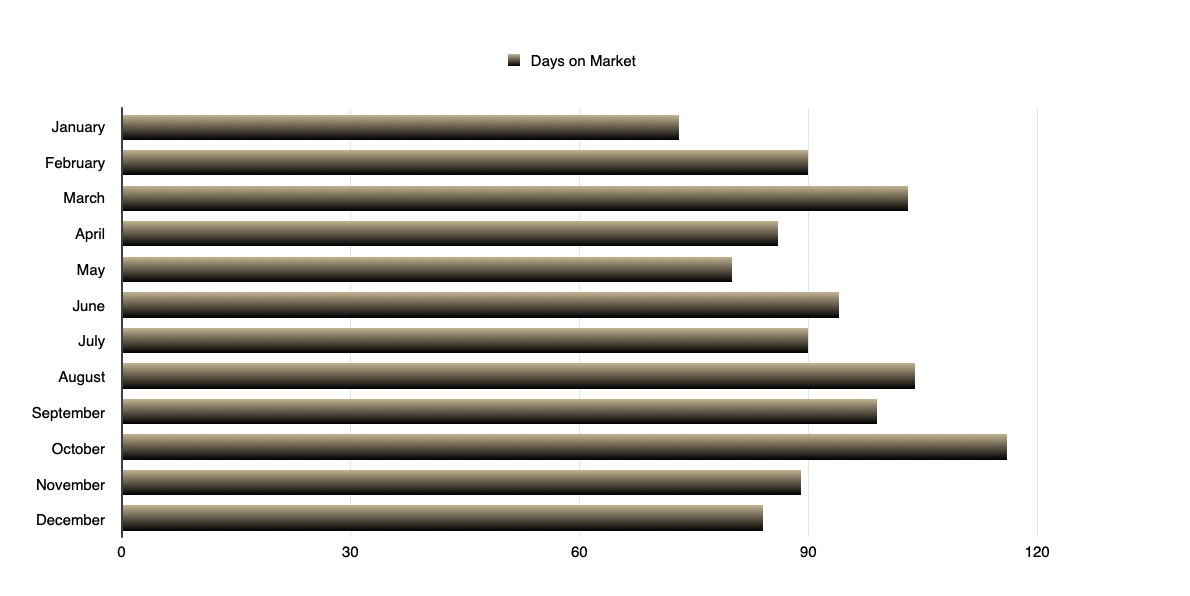
Have a look at the year-end 2020 graphs below. It’s very interesting to look at the average price and days on market correlation over the last 4 years. Days on market is flat from 2019 to 2020, after a 20% decrease in both 2017 and 2018. While the average price continues to increase by 23% from 2019 to 2020, after an increase of 11% from 2018 to 2019, and a 10% increase from 2017-2018.


Single Family Homes – 2020


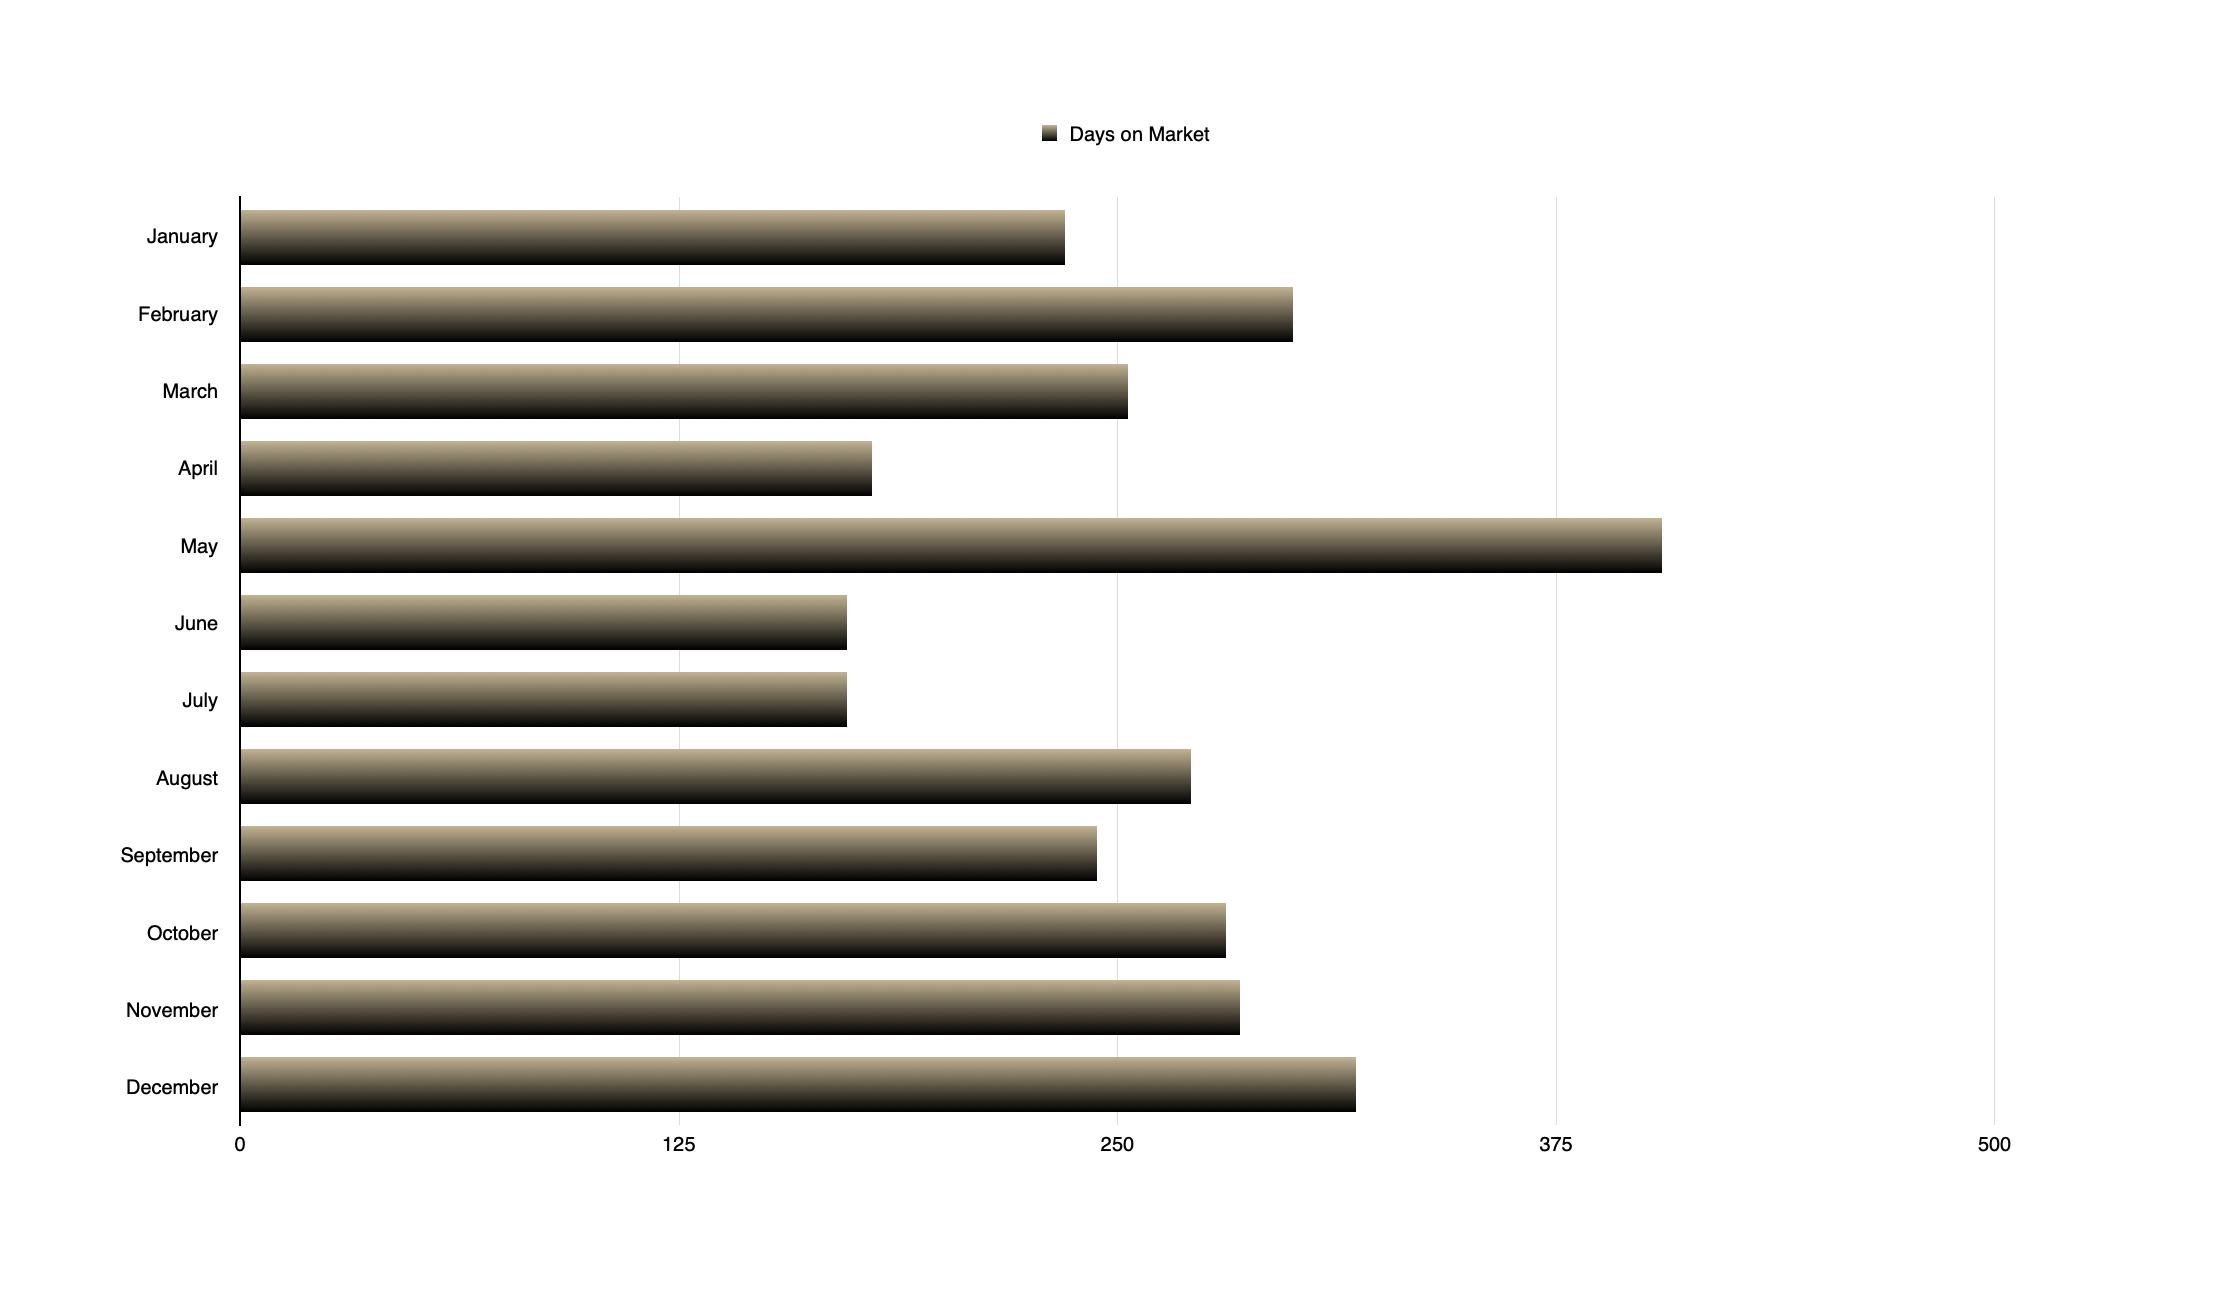
Condos – 2020


Land
Average land prices increased year over year from 2017 – 2020; 15% 2017 – 2018, 17% 2018 – 2019, and 16% 2019 – 2020.


A look forward
“Many experts are predicting another strong housing market in 2021. They are forecasting increased demand from buyers who delayed purchasing homes because of the pandemic; from existing homeowners who need larger spaces to accommodate parents working from home and children attending school virtually; and from condo owners who are seeking to escape multifamily buildings for single-family houses to mitigate exposure to the virus. The ability to tour homes and close on purchases virtually will make buying a home simpler in 2021.”
You can read the full Washington Post article here.
Check back with us here on the first Saturday of each month to get the latest Smoky Mountain Real Estate stats.
*Note: statistics collected using the Bluff Mountain, Chalet Village, Cobbly Nob, Douglas Lake, Gatlinburg, Jones Cove, Kodak, New Center, Pigeon Forge, Pittman Center, Sevierville, Seymour, and Wears Valley areas.