
January through April 2026 sold data for STR eligible properties across Sevier County
The first four months of 2026 are in the books, and the data tells a clear story. Sales activity has climbed every single month, total volume has nearly doubled from January to April, and the average sale price is trending up alongside it.
For investors, sellers, and anyone watching the Smoky Mountain short term rental market, this kind of consistency matters.
It is not a hot market and it is not a cold one. It is a steadily strengthening market with predictable patterns that reward preparation.
We pulled the sold data for every STR eligible property across Bluff Mountain, Chalet Village, Cobbly Nob, Douglas Lake, Gatlinburg, Jones Cove, Kodak, New Center, Pigeon Forge, Sevierville, Seymour, and Wears Valley.
Here is what the numbers are showing us.
Sales Activity Has Climbed Every Month
From January through April, the market moved in one direction. Each month delivered more closings, more volume, and a higher average sale price than the one before it.
| Month | Sales | Volume | Avg Sales Price |
| January 2026 | 53 | $30,989,315 | $584,704 |
| February 2026 | 68 | $38,708,865 | $569,248 |
| March 2026 | 70 | $46,697,426 | $667,106 |
| April 2026 | 87 | $59,048,824 | $678,722 |
| Q1 + April Total | 278 | $175,444,430 | $631,095 |
A few takeaways from the monthly trajectory:
- Closings increased 64 percent from January to April, climbing from 53 to 87 transactions.
- Total dollar volume nearly doubled, growing from roughly $31 million in January to over $59 million in April.
- The average sale price moved from $584,704 in January to $678,722 in April, a 16 percent increase over the four month window.
Where the Volume Is: Two and Three Bedroom Properties
Bedroom count continues to be one of the most useful filters for understanding this market. When we break out closings by size, the pattern is unmistakable.
| Bedrooms | Sales (Jan–Apr) | Average Sale Price |
| 1 bedroom | 39 | $376,881 |
| 2 bedrooms | 98 | $473,191 |
| 3 bedrooms | 88 | $641,891 |
| 4 bedrooms | 29 | $805,359 |
| 5 bedrooms | 9 | $1,272,222 |
| 6 bedrooms | 8 | $1,237,063 |
| 7 bedrooms | 1 | $1,275,000 |
| 8 bedrooms | 5 | $2,042,000 |
| 11 bedrooms | 1 | $1,700,000 |
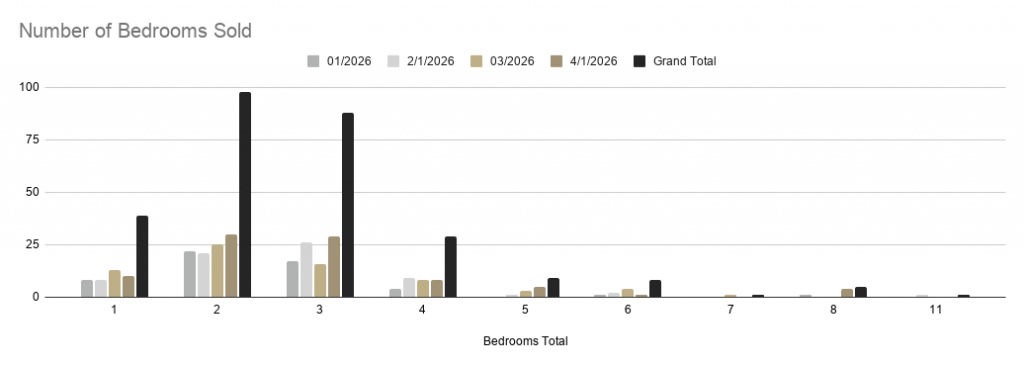
Two and three bedroom properties accounted for 186 of the 278 total sales, which is 67 percent of all transactions.
One interesting note from the bedroom data is that 5 and 6 bedroom average prices were close to each other ($1,272,222 versus $1,237,063), with 5 bedroom homes edging slightly higher. That tells us the bedroom count alone is not driving price at the upper end.
Location, amenities, views, and rental history are doing the heavy lifting.
Days on Market: Cabins Are Selling Faster as the Year Progresses
Single family homes and cabins are the engine of this market, and the pace at which they are selling has shifted meaningfully across these four months.
In January, the median days on market for a cabin sat at 72. By March and April, that number had dropped to 32. Buyers are moving more decisively as the spring season opens up, and well priced properties are getting picked off quickly.
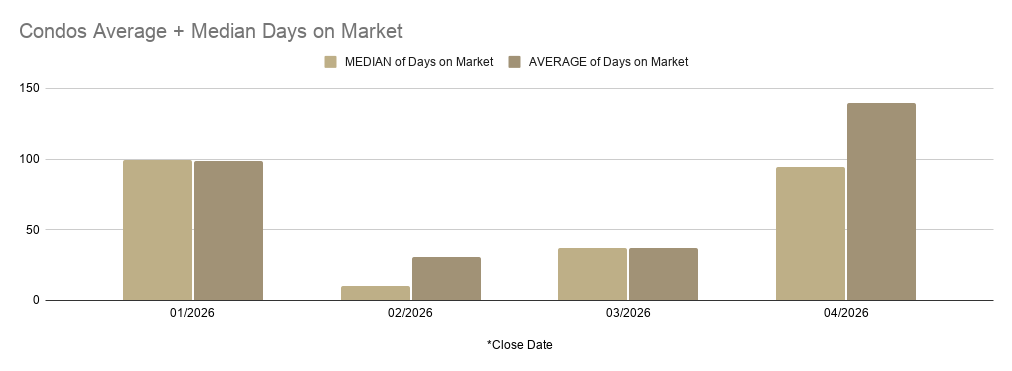
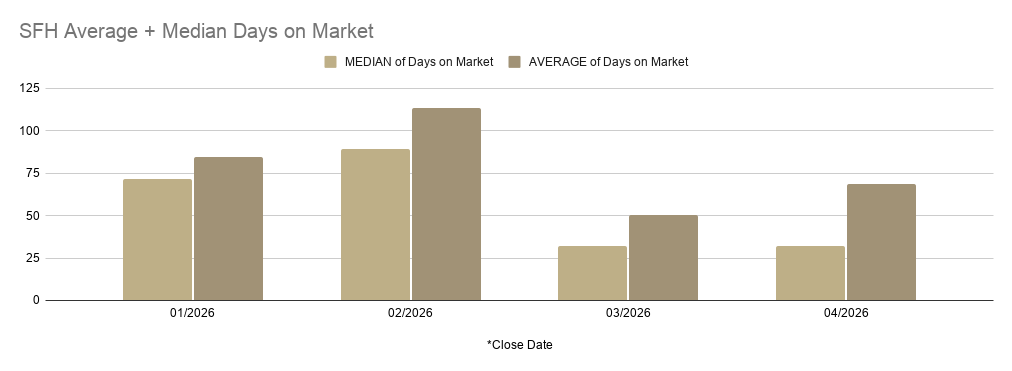
Across the full four month window for STR eligible properties, the picture looks like this:
- Cabins: median 40 days, average 75 days
- Single family residences: median 59 days, average 122 days
- Condominiums: median 44 days, average 93 days
The gap between the median and the average is worth paying attention to. When the average is significantly higher than the median, it means a handful of properties are sitting on the market much longer than the typical sale and bringing the average up.
For sellers: The properties pulling those averages higher are almost always the ones that were priced too aggressively at the start.
Pricing accurately from day one continues to be the single most important decision a seller makes.
Where the Premium Properties Are Trading
Location continues to define value in the Smokies. Here is how average close prices broken down by MLS area for STR eligible properties through April.
| MLS Area | Avg Close Price | List-to-Sale Gap |
| Bluff Mountain / Walden | $1,051,063 | 11.14% |
| Chalet Village | $1,026,338 | 11.68% |
| Cobbly Nob | $702,383 | 3.25% |
| Wears Valley | $695,466 | 9.61% |
| Sevierville | $612,315 | 9.13% |
| Pigeon Forge | $611,511 | 8.51% |
| Gatlinburg | $575,748 | 10.43% |
| Jones Cove | $456,667 | 1.04% |
| Seymour | $369,243 | 5.43% |
| Kodak | $368,431 | 12.79% |
| New Center | $283,500 | 23.22% |
| Market Average | $631,095 | 9.25% |
Bluff Mountain, Walden, and Chalet Village led the market on average close price, both clearing $1 million.
These areas continue to attract buyers who want larger cabins with views and proximity to Gatlinburg attractions.
The list to sale price shows the percentage difference between what sellers originally asked and what the property ultimately closed at.
Across the whole market, the average gap was 9.25 percent.
A few areas tell their own story:
- Jones Cove (1.04 percent) and Cobbly Nob (3.25 percent) closed remarkably close to original list price, which suggests pricing in these areas was accurate from the start.
- New Center (23.22 percent) and Kodak (12.79 percent) showed the largest gaps. In areas with fewer comparable sales, mispricing happens more often, which leaves room for negotiation if you are buying.
- Bluff Mountain, Chalet Village, and Gatlinburg all hovered between 10 and 12 percent, which is in line with the broader market average.
What This Means for Buyers and Sellers
If you are buying: Inventory is moving, but the days of overpaying out of urgency are not back. The data shows buyers had time to evaluate properties, especially in January and February. As we head deeper into the year and DOM compresses, that window will narrow. Well priced, well located cabins in the two to three bedroom range continue to be the most competitive segment.
If you are selling: Pricing accuracy is everything. The properties closing fastest are the ones that hit the market with realistic pricing and strong presentation. With an average list to sale gap of 9.25 percent across the market, sellers who start too high are absorbing real costs in time and final sale price. Get your rental history, your maintenance records, and your photos in order before you list.
If you are watching the market: The trajectory through the first four months of 2026 looks healthy. Volume is rising, prices are firming, and the market is rewarding sellers and buyers who come to the table prepared. This is the kind of environment where good decisions get rewarded and shortcuts get punished.
Let Us Help You Make Sense of the Numbers
Market reports give you the big picture. What matters next is how the data applies to your specific property, your specific neighborhood, and your specific timeline.
We have been working in these mountains since 1996. We own STRs, we have built them, we have bought and sold them, and we know what the numbers actually mean once you get past the averages. If you are thinking about buying, selling, or just trying to understand where your property fits in this market, reach out. We would love to talk it through with you.
Data Notes: Data pulled from the GSM MLS for closed sales between January 1 and April 30, 2026. Includes only properties that can be used as short term rentals. Areas included: Bluff Mountain, Chalet Village, Cobbly Nob, Douglas Lake, Gatlinburg, Jones Cove, Kodak, New Center, Pigeon Forge, Sevierville, Seymour, and Wears Valley. Not all rental properties have documented rental income inside the MLS.