Days on market ranged from 215 to 192 this year. Days on Market rose from January to April, and then decreased from May to November, followed by an increase in December. Days on market peaked in April at 215 days and fell to 186 in November.

Average List Price was lowest in January and rose until June, there was a decrease from July to October, with an increase in November and December. From $192,370 in January to $207,879 in June, with a decrease to $203,611 in October, and an increase to $205,853 in December. A rise of 8% and a $15,000 span.
Average Sale Price was lowest in January and rose until July, there was a decrease from August to October, with an increase in November and December. From $180,639 in January to $194,604 in July, with a decrease to $192,786 in October, and an increase to $194,236 in December. A rise of 7% and a $13,000 span.

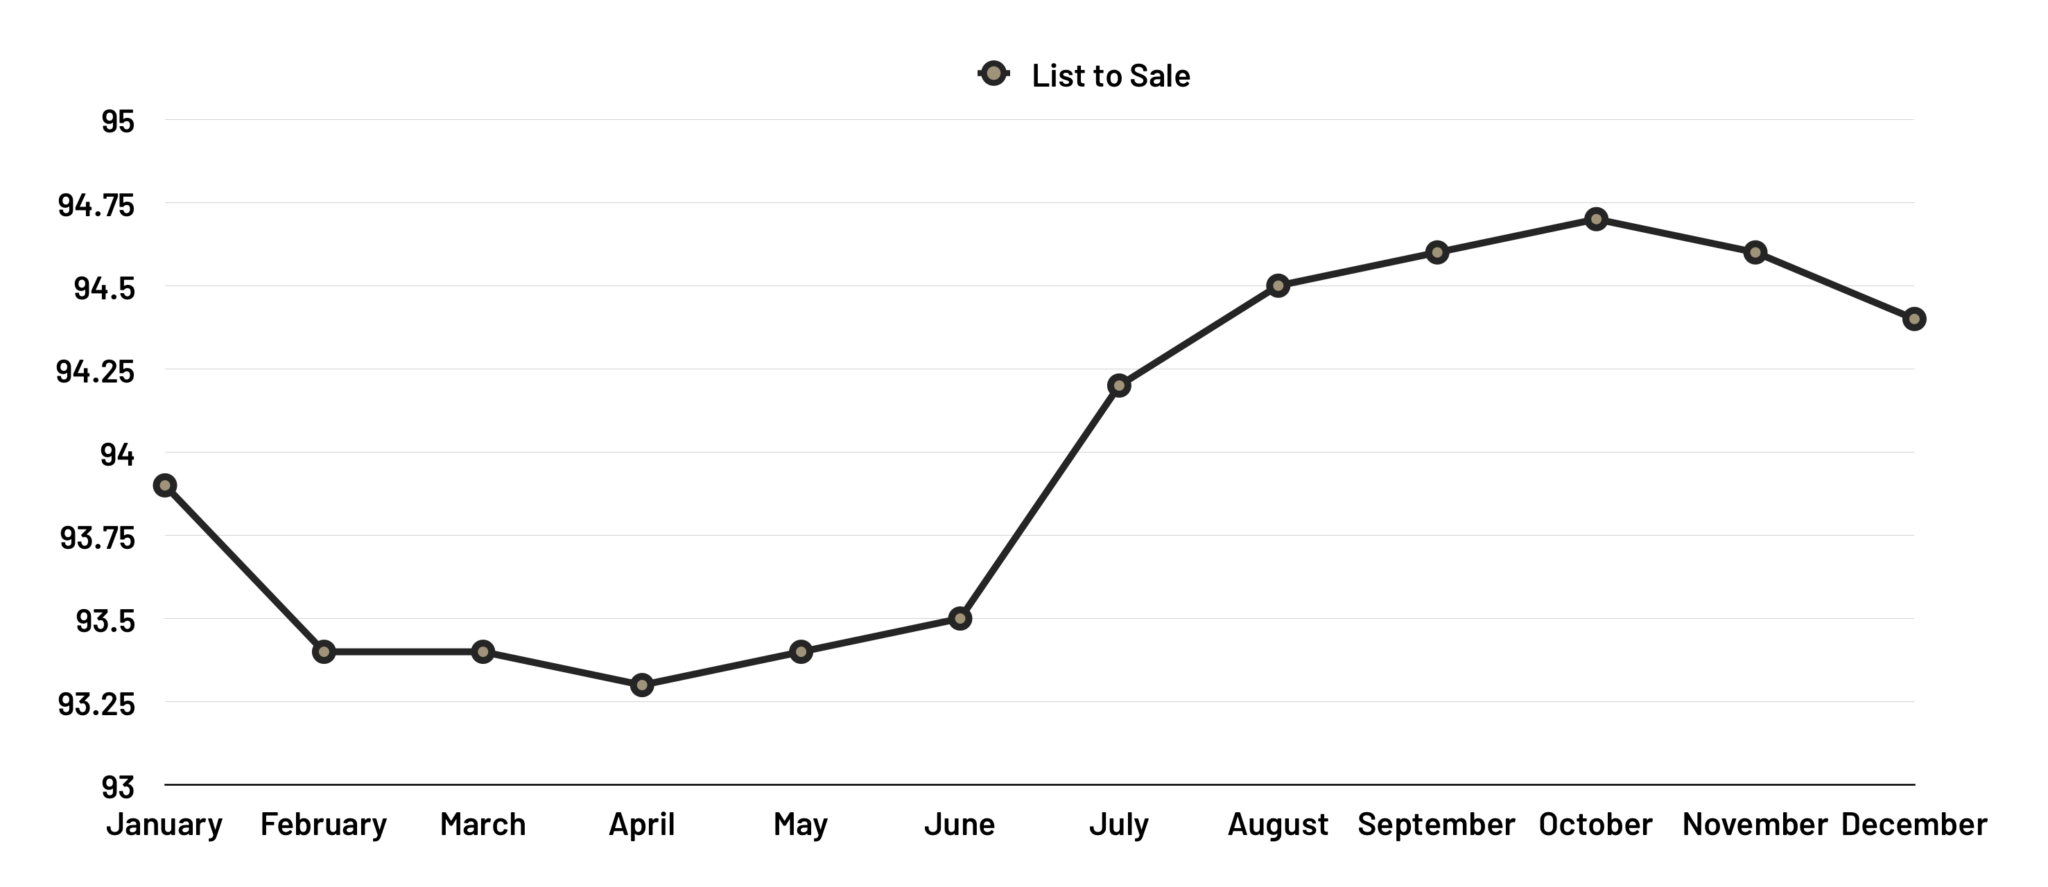
List to sale price ration ranged from 93.3% to 94.7% this year. List to sale price ratio peaked in October to 94.7%, and was the lowest at 93.3% in April.