January 2026 Smoky Mountain Real Estate Market Report

This month resulted in a slower residential pace, with fewer closings, lower average prices, and longer days on market. While land sales were down in count but moved faster than last year.


Residential


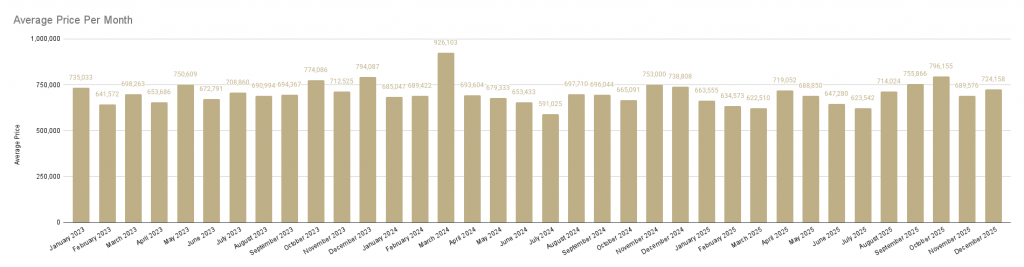
Residential sales totaled 51 closings this month in 2026, compared to 59 closings in 2025, which is a 13.56% decline year over year. 

The average residential sale price came in at $555,810, down from $723,114 last year (-23.14%). 

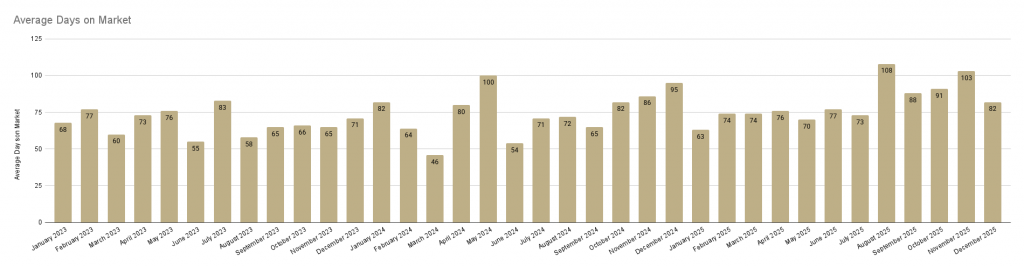
Homes also took notably longer to sell. Average days on market increased to 145 days, compared to 63 days in 2025, which is a 130% jump. 

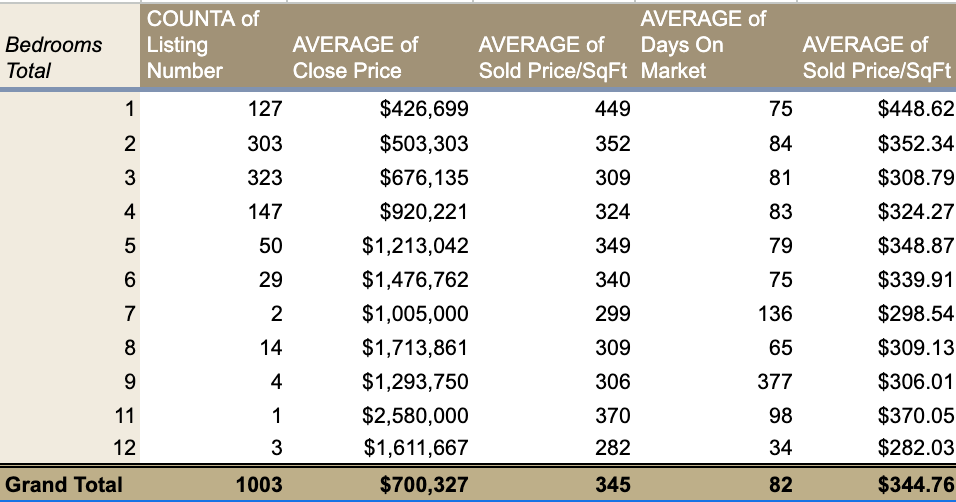
Even with the slower pace, pricing per square foot stayed fairly steady by comparison. Price per square foot averaged $304 this month, down from $328 last year (-7%). 

With fewer sales and a lower average price, total residential volume dropped to $28,346,315, down from $42,663,768 in 2025 (-34%, or -$14,317,453).


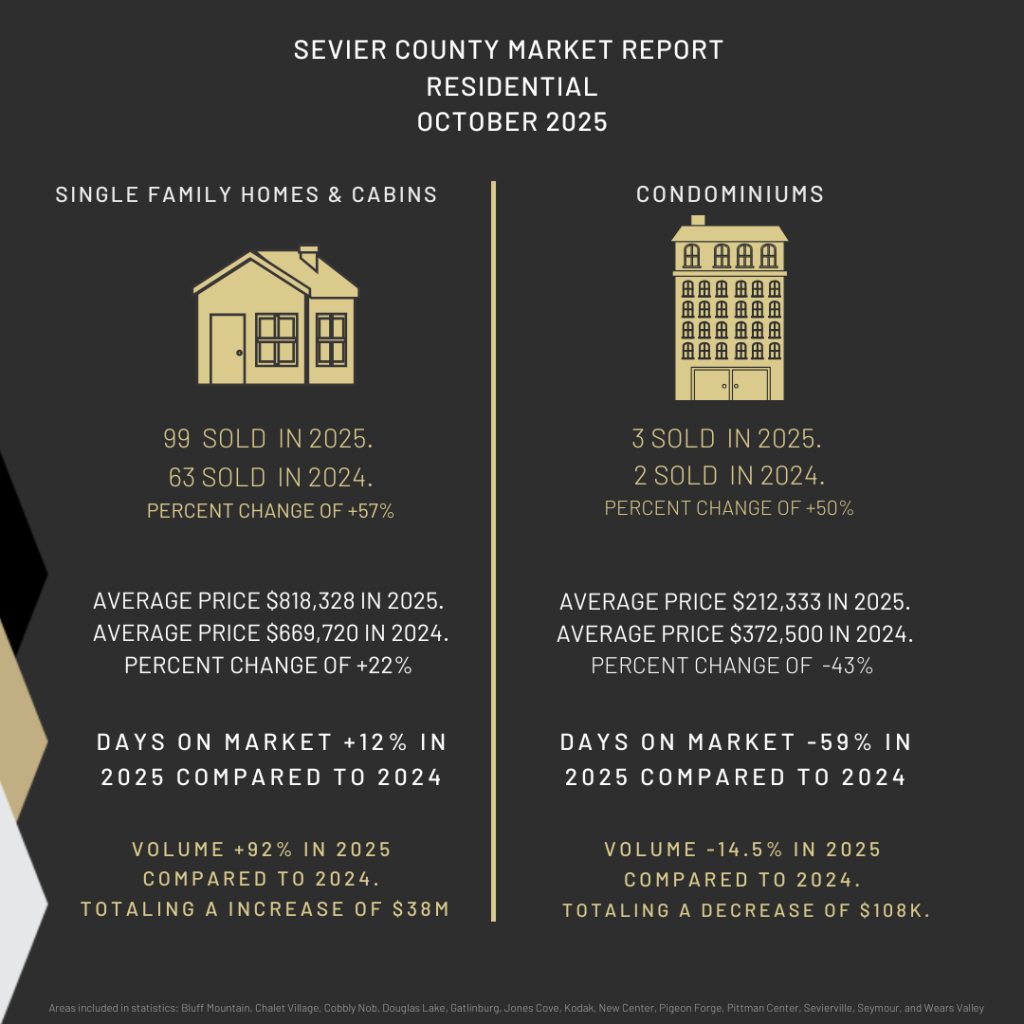
Single Family Homes & Cabins

Single family and cabin sales made up the bulk of residential activity again this month, and this segment is where most of the year-over-year change showed up. 

45 single family homes and cabins sold in 2026, compared to 57 in 2025, which is a 21% decrease. 

The average sale price in this category was $568,230, down from $739,031 last year (-23.11%). 

The pace of the market slowed here as well. Average DOM rose to 148 days, compared to 63 days in 2025 (+135%). 

Price per square foot averaged $305, down from $332 last year (-8%). 

In total, single family/cabin volume came in at $25,570,365, compared to $42,124,768 last year (-39%, or -$16,554,403).


Condos

Condo numbers were small this month, so the percentage changes look dramatic, but they’re still worth noting. 

4 condos sold this month in 2026, compared to 1 condo in 2025. 

The average condo sale price was $447,187, up from $280,000 last year (+59.71%), This average was skewed by a higher price sale at the Highlands of the Smokies and a singular sale last year. 

Condos also took a bit longer to move. Average DOM increased to 98 days, up from 70 days in 2025 (+40%). 

The price per square foot rose to $358, compared to $233 last year (+54%). 

With multiple closings this month, total condo volume came in at $1,788,750, compared to $280,000 in 2025 (+538.84%, or +$1,508,750).


Land


Land activity pulled back significantly this month compared to last year. 

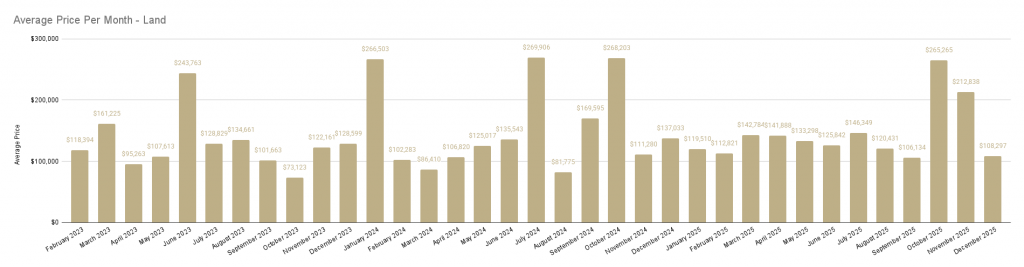
12 land lots sold in 2026, down from 27 in 2025, which is a 56% decrease. 

Even with fewer sales, the average land price increased to $136,741, up from $122,237 last year (+11.87%). 

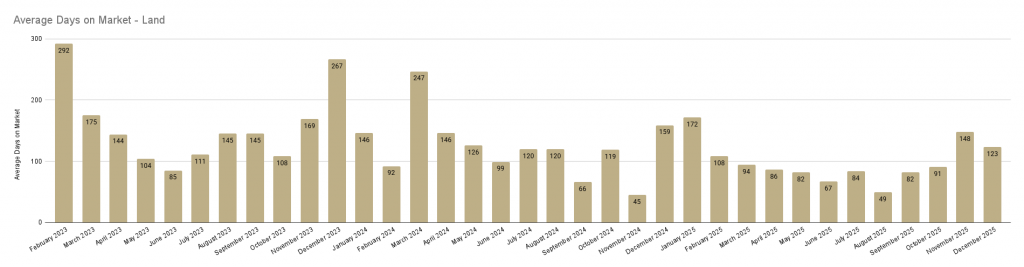
One of the more notable shifts was time to sell. Land DOM improved to 85 days, down from 160 days in 2025 (-47%). 

With fewer closings overall, total land volume landed at $1,640,900, compared to $3,300,400 last year (-50%, or -$1,659,500).


The Takeaway This Month

This month’s data reflects a market that is moving slower on the residential side, especially in the single family/cabin segment, with higher days on market and lower overall volume than the same month last year. 

At the same time, land sales were down in count and total volume, but the lots that did sell moved faster and at a higher average price.

If you’re trying to decide whether to list, buy, or invest, especially if short-term rental performance is part of your plan, the numbers matter, but so does the property type and the strategy. 

We’d love to help you interpret what this month’s data means for you. Contact us today! 


2024 vs. 2025 Smoky Mountain Real Estate Market Recap: A Look at Pricing and Days on Market

Each year, we step back and look at what actually happened in the Smoky Mountain real estate market. 

This recap compares 2024 and 2025 market performance specifically around pricing and days on market.

If you’d like to further look at an overall recap of 2025, read this blog,  and if you’d like to learn more about bedroom count and market behavior, read this blog post.


Residential Sale Prices: Stability, Not Swings

Residential sale prices in 2025 closely mirrored 2024 levels.

While both years experienced normal month-to-month variation, pricing stayed within a relatively tight range. There were no sustained price run-ups and no broad declines over the course of the year. 

Notably, the sharper volatility seen in parts of 2023 did not reappear in either 2024 or 2025. From a year-over-year perspective, 2025 reflected pricing stability rather than appreciation or contraction.


Residential Days on Market: Gradual Normalization

Average days on market for residential properties increased in 2025 compared to 2024.

Homes generally took longer to sell, but the shift was gradual, the increase occurred across multiple months. 

Importantly, even with longer timelines, residential properties continued to move.


Land Sale Prices: Ongoing Volatility

Land pricing behaved very differently than residential pricing.

Average land sale prices fluctuated widely throughout both 2024 and 2025. Monthly averages were heavily influenced by the specific parcels that closed during each period, resulting in sharp month-to-month changes without a consistent upward or downward trend.

This pattern was not new. Similar volatility was present in 2023 and continued through both subsequent years, reinforcing how transaction-specific land pricing can be in the Smokies.


Land Days on Market: Consistently Extended

Land continued to record the highest and most variable days on market across all years reviewed.

In 2025, land listings routinely remained active for extended periods, with significant variation from month to month. This behavior closely mirrored 2024 and aligned with the longer-term trend established in 2023.

Unlike residential properties, there was no compression in land selling timelines year over year. Land consistently required substantially more time to sell.


Year-Over-Year Summary

When comparing 2024 and 2025:

  • Residential prices remained largely unchanged
  • Residential days on market increased modestly
  • Land prices fluctuated without a sustained trend
  • Land days on market remained elevated and inconsistent


The 2025 Smoky Mountain real estate market reflected continuation rather than disruption.

Residential pricing held steady, sales timelines lengthened modestly, and land continued to behave independently, driven by parcel-specific factors rather than broad market momentum.

For buyers, sellers, and investors, this type of market underscores the importance of property-level analysis. 

As always, we’ll continue tracking the data and sharing what it actually shows so you can make informed decisions rooted in the reality of our local market.

Interested in buying or selling in the Smokies, contact us!


Bedroom Count and Market Behavior in the Smoky Mountains: 2025 Review

Bedroom count is one of the most commonly used filters in real estate searches, but by itself it doesn’t explain how the market behaves. When we group sold listings by bedroom count, clear differences emerge in sales volume, pricing, time on market, and rental performance.

These differences describe how, if at all, predictable outcomes are at different sizes.


Sales volume was strongest in the 2–3 bedroom range, which accounted for the largest share of all closed listings.
Activity declined starting at four bedrooms and dropped more sharply as bedroom count increased beyond that point.

  • 2–3 bedroom homes represented the largest segment of the market
  • 4-bedroom homes continued to sell at a meaningful pace, but at less than half the volume of 2–3 bedroom homes
  • 5+ bedroom homes made up a much smaller share of total transactions
  • 7+ bedroom homes sold infrequently, often with only a handful of sales


How Bedroom Count Related to Time on Market

Median days on market remained relatively consistent through the mid-range bedroom counts.

  • 1–4 bedroom homes clustered tightly around similar median timelines
  • 5–6 bedroom homes showed modest increases in median days on market
  • 7+ bedroom homes showed wide variation, including both very short and very long timelines

This indicates that outcomes become less consistent as bedroom count increases and sales volume decreases.


Price Per Square Foot Changes With Size

Price per square foot declined as bedroom count increased, even as total sale prices rose.

    • Smaller homes consistently sold at higher price-per-square-foot levels
    • Larger homes sold for higher total prices, but at lower price-per-square-foot levels
  • Four- and five-bedroom homes often represented a midpoint where total price increased without the sharpest drop in price efficiency


Rental Performance Scales With Increasing Variability

Documented rental history** increased as bedroom count increased through the mid-range.

    • Median rental figures rose steadily from 1 to 6 bedrooms
  • Six-bedroom homes showed a significant jump in median rental history
  • Beyond six bedrooms, rental performance became uneven, with wide variation between properties

At higher bedroom counts, small sample sizes and property-specific factors had a greater impact on results. This makes category-level conclusions less reliable.


Why Medians Matter at Higher Bedroom Counts

Average figures widened significantly at larger bedroom counts.

  • Days on market averages increased sharply due to a small number of long-running listings
  • Rental averages were heavily influenced by individual properties
  • One or two sales could materially change the averages for a category

For this reason, median figures provide a more stable view of typical performance, especially where sales volume is thin.


What Changes as Bedroom Count Increases

Based on the sold data:

  • 2–4 bedrooms: highest liquidity and most consistent outcomes
  • 5–6 bedrooms: higher upside with narrower margins for pricing and positioning errors
  • 7+ bedrooms: outcomes become highly property-specific due to limited transaction volume

Bedroom count does not determine success on its own, but it changes how sensitive a property is to pricing, timing, and individual characteristics.


Understanding where a property falls within these ranges helps set expectations for pricing strategy, timelines, and risk.  


*Areas included in statistics are Bluff Mountain, Chalet Village, Cobbly Nob, Douglas Lake, Gatlinburg, Jones Cove, Kodak, New Center, Pigeon Forge, Pittman Center, Sevierville, Seymour, and Wears Valley. Includes Only properties that can be used as a short term rentals.

**This data is pulled from the GSM MLS. Not all properties that are rentals have documented rental income inside the MLS. 


2025 Smoky Mountain Real Estate: What the Sold Data Actually Shows

When we step back and look at every closed sale from 2025* a few things become very clear:

  • Buyers were active, but selective
  • Pricing accuracy mattered more than ever
  • Location and property type drove outcomes far more than headlines 


Pricing Accuracy & Market Speed

This was the defining theme of 2025. Homes priced correctly from the start behaved very differently than those that missed the mark.

Based on sold listings, properties that closed at or above their original list price overwhelmingly sold faster and with far less friction than those that required price corrections.

  • Homes that sold at or above original list typically closed within 30 days
  • Properties that sold below original list most often landed in the 120+ day range
  • Listings that ultimately sold below their original list price were far more likely to spend extended time on the market. Once pricing had to be adjusted, average days on market increased substantially.

This confirms what we saw anecdotally all year:  buyers were willing to act quickly, but only when pricing aligned with perceived value.


What Buyers Actually Bought 

Looking at total sales by property type, one category clearly dominated activity.

  • Cabins and single-family homes accounted for the majority of all sales
  • These property types also commanded the strongest price per square foot
  • Condos and specialty property types represented a much smaller share of total transactions 


Location Still Matters, But Not All Locations Perform the Same

When we break sales down by city single family homes show:

  • Sevierville led total sales volume, reflecting its mix of STR-friendly areas and accessibility 
  • Gatlinburg and Pigeon Forge commanded higher price per square foot, but generally took longer to sell 
  • Days on market were relatively consistent across the top cities, suggesting demand remained stable


Condos Told a Very Different Story

Condos behaved differently from single-family homes in nearly every metric.

  • Sales volume was significantly lower
  • Average days on market were higher
  • Price per square foot was more compressed
  • Performance varied sharply by city 

In short: condos were more price-sensitive and required sharper positioning to move.


New Construction vs Existing Homes

One of the more interesting takeaways from the data is that new construction did not automatically outperform existing homes.

  • New construction did command higher prices and higher price per square foot
  • However, days on market were effectively the same
  • Existing homes represented the vast majority of closed sales 

Buyers weren’t looking for “new”  they were looking for value, layout, and location.


Median Data Tells the Real Story

Averages can be skewed in a market like ours. Medians tell a cleaner story.

Looking at median performance by property type:

  • Single-family homes and cabins both showed strong median price-per-square-foot performance 
  • Condos lagged on both pricing and speed 
  • Days on market remained reasonable for properties aligned with buyer expectations 

This reinforces the broader theme of the year: buyers were intentional.


From a full-year perspective, 2025 looks like a healthy normalization year.

Pricing accuracy mattered more than ever.
Turnkey, well-located properties were rewarded.
Buyers took their time, but were still present. 
Sellers who adjusted expectations early did well.


This is what a sustainable market looks like after several overheated years, and it sets the stage for informed, confident decisions going forward.


*Areas included in statistics are Bluff Mountain, Chalet Village, Cobbly Nob, Douglas Lake, Gatlinburg, Jones Cove, Kodak, New Center, Pigeon Forge, Pittman Center, Sevierville, Seymour, and Wears Valley. Includes Only properties that can be used as a short term rentals.


December 2025: How the Smoky Mountain Real Estate Market Closed the Year

December is often assumed to be a slow month in real estate, but the numbers tell a very different story about how the Smoky Mountain market closed out 2025. 

Instead of winding down, December showed a market that was active, steady, and driven by informed buyers making thoughtful decisions.


Strong December Activity

The market recorded 151 residential sales totaling just over $109 million in volume in December 2025.

The average sales price came in at $724,158.
Average days on market settled at 82.
Price per square foot averaged $374. 

Compared to December 2024, sales were up 28 percent, total volume increased 27 percent, and days on market improved by 13 percent, while pricing remained essentially flat. 

This tells us that activity wasn’t driven by rising prices or urgency. Buyers were active, but disciplined, buying when the numbers made sense, rather than chasing inflated pricing.


Single-Family Homes Led the Close of the Year

Single-family homes continued to carry the market through December. 

A total of 136 single-family homes sold, also up 27 percent year over year, with an average sales price of $771,297. 

Days on market improved to 81, and nearly $105 million in single-family volume closed before year end. 

When sales increase while prices remain steady and homes sell faster, it’s a strong sign of buyer confidence paired with selectivity. 

Well-priced, well-maintained homes moved, while properties that stretched above market expectations took longer to find buyers.


What Price Per Square Foot Tells Us

One of the clearest signals in December was price per square foot. 

Residential price per square foot averaged $374, while single-family homes averaged $364, both lower than peak months earlier in the year despite strong sales activity. 

This shows buyers weren’t chasing size or luxury premiums. 

Instead, they focused on usable space, condition, and overall value, reinforcing that practical, turnkey homes were the most competitive as the year closed.


Condos saw 11 sales in December, with an average price of $305,181 and days on market around 90. 

While interest was present, buyers took more time, carefully weighing their options. 


Land sales held steady at 21 lots sold, but average pricing adjusted downward, and days on market remained higher.

Buyers were still active, but they negotiated more and approached long-term projects cautiously, favoring properties that offered immediate use and clearer value.


What December Tells Us Going Into 2026

December confirmed a recalibrated market. 

Buyers were present and sellers who priced realistically were rewarded. 

Homes that were ready to go continued to move. 

The Smoky Mountain market closed 2025 in a healthy, balanced position, setting the stage for a confident and steady start to 2026.


November 2025 Smoky Mountain Real Estate Market Update

As November comes to a close, the Smoky Mountain real estate market is offering its clearest signal yet: we are in a period of stabilization.

The feverish pace of 2021–2023 is firmly behind us and in its place is a more deliberate market where buyers take their time, evaluate conditions carefully, and show strong interest in well-located and truly turnkey vacation rentals.

Buyers are becoming more discerning. Sellers who price strategically and present their properties well continue to see results.

What we are seeing now is a market correcting to sustainable, pre-pandemic patterns with continued demand for cabins that show well, perform well on the rental market, and offer buyers confidence in both use and income.


Residential Market Overview

Across all residential property types, there were 71 closings this November compared to 80 at this time last year, an 11% decrease. This tells us that buyers remain active, but they are more cautious than before.

The average residential sales price decreased from $747,500 last year to $689,576 in 2025, a 7.75% drop.

Importantly, this does not indicate depreciation across the board. Instead, it reflects a shift in the types of homes that are selling. Higher-end properties,  which significantly influence averages,  are moving more slowly, while moderately priced cabins make up a larger portion of this year’s activity.

The average time to sell has increased from 81 days to 103 days, a 27% rise. Buyers are comparing options and negotiating more firmly. Pricing and presentation matter now more than they have in several years.

Price per square foot fell from $368 to $319, a 13% decline that aligns with the shift toward smaller, lower-priced properties making up a greater share of this year’s closings.

Total volume dropped by 18%, from $59.8M to $48.9M, confirming that while buyers are present, they are purchasing at lower price points and with more restraint.


Single-Family Homes (Cabins & Residences)

Compared to last year, 64 single-family homes sold this November, down from 75, marking a 15% decrease.

Buyer demand is still solid, but the sense of urgency that defined the last few years has eased substantially.

The average single-family sales price declined about 6%, from $775,641 to $731,593.

This is not due to widespread depreciation but to the changing mix of homes that closed. Luxury cabins typically inflate average prices, and with fewer of them selling, the overall average naturally shifts downward.

Days on market increased from 83 to 100 days. Price per square foot decreased from $372 to $327, a 12% drop that further supports the trend of buyers choosing mid-tier options rather than stretching for high-end inventory.

Total single-family volume fell from $58.1M to $46.8M, a 20% decrease consistent with the reduced number of luxury properties changing hands.

Condos

The condo market remains a small, highly variable segment, where just one sale can cause significant swings in the data.

Six condos sold this November, compared to four last year.

Although average price appears to have risen from $294,225 to $314,666, this comparison is skewed because 2025 included a $600k outlier sale. Without that anomaly, this year’s average was closer to $257,000, meaning this year’s price is far more modest.

Condos took much longer to sell this November — 146 days versus 54 last year.

With such limited sales, trends can be difficult to interpret, but the increased days on market suggest heightened buyer pickiness and a slower-moving segment overall.

Price per square foot increased slightly, from $228 to $249, while total condo volume rose from $1.17M to $1.88M.


Land

Perhaps the most notable shift this year is in the land market. Only 13 land parcels sold this November compared to 27 last year, a 52% decrease.

High construction costs and extended building timelines have caused many buyers to favor existing cabins over new-build opportunities.

Interestingly, while the number of sales decreased, the average land price rose sharply from $113,148 to $212,838, an 88% increase.

This reflects a shift in the type of land being purchased. The parcels selling today are more often view lots or build-ready parcels, not lower-priced or more challenging tracts.

Days on market increased dramatically, from 45 to 148 days, showing that land is taking much longer to move.

Total land volume dipped slightly from $3.05M to $2.76M.


What the Market Is Really Telling Us

Buyers are present and motivated, but far more selective than they were in recent years. They are willing to pay strong prices for cabins that are turnkey, well-located, and rental-ready, but they are not rushing into purchases or overpaying for homes that need work.

Turnkey condition matters more than ever. Properties that photograph beautifully, feel updated, and offer a seamless transition into rental use continue to receive good attention.

Land demand has softened significantly. Many buyers prefer cabins they can use or rent immediately, especially when construction timelines and building costs remain elevated.

Finally, days on market are stretching across the board, signaling a return to pre-COVID norms rather than a weakening market.

A more measured pace gives buyers the breathing room they lacked for several years and rewards sellers who prepare, price properly, and stand out in today’s more strategic marketplace.


If you’d like a personalized look at how these trends affect your buying or selling plans, or you’re considering an investment property and want guidance rooted in decades of local expertise, we’re here to help! The Jason White Team has been serving Smoky Mountain buyers, sellers, and investors since 1996, and we’d be honored to support your next step.


Smoky Mountain Real Estate Market Update: October 2025

As we move through the final quarter of 2025, the Smoky Mountain real estate market continues to show strength, particularly in the single-family home segment. 

Even with interest rate fluctuations throughout the year, our local market has held steady, posting higher prices, stronger sales, and a significant year-over-year gain in total volume.

If you’ve been wondering what this means for buyers, sellers, and investors across Gatlinburg, Pigeon Forge, and Sevierville, here’s a closer look at how the numbers stack up.

Market Overview: October 2025 vs. October 2024

Residential Sales:

  • 103 homes sold in October 2025, up 49% from 69 in 2024. 

Average Price:

  • Up 20.6% year-over-year, from $659,981 to $796,155. 

Days on Market:

  • Up modestly from 82 to 91 days. 

Price Per Square Foot:

  • Down slightly (-11%) to $346/sq.ft. 

Total Volume:

  • Up 80% year-over-year, from $45.5M to $82M. 


Single-Family Homes Drive the Market

Single-family homes continue to lead the charge across Sevier County:

  • 99 single-family homes sold, up 57% from last year.
  • Average price: up 22% to $818,328.
  • Total sales volume: up a remarkable 92% — from $42.2M to $81M. 

Even though price per square foot dropped slightly (-6%), that’s largely due to a higher number of large-format cabins selling this year, not a sign of market weakness.


Condos: Smaller Pool, Quicker Sales

Condo activity softened slightly:

  • Average price: down 43%, from $372,500 to $212,333.
  • Sales volume: down 14.5%, but
  • Days on market: dropped 59%, meaning condos that do list are selling quickly if priced correctly. 


Land & Lots: Holding Value Amid Fewer Transactions

Land sales volume dipped 22% year-over-year, though the average price per lot rose slightly to $265,265.


Year-Built Trends: What’s Driving Higher Prices?

We also analyzed average sale price by year built, comparing 2024 and 2025 sales. The results reveal clear buyer preferences.

When we analyze sale prices by year built, the results aren’t linear and that tells an important story. If age alone dictated price, older homes would sell for less across the board. But that’s not what’s happening in the Smokies.


Newer Homes (2020–2025)

  • Average price: climbed from roughly $980K in 2024 to $1.1M+ in 2025.
  • These homes combine modern finishes, low maintenance, and rental-ready amenities — a combination that continues to command top dollar. 

Mid-2000s Homes (2005–2009)

  • Still performing exceptionally well, with multiple years averaging $730K–$1.3M.
  • This period represents many of the large-cabin builds that dominate the short-term rental market — buyers know their income history and reliability. 

1990s–Early 2010s Homes

  • Prices range from $450K–$650K, with modest year-over-year appreciation.
  • Updated homes in this age bracket continue to attract both investors and second-home buyers looking for value. 

Pre-1990s Construction

  • Wide variation from $135K to over $700K.
  • Well-maintained legacy properties with character and views perform strongly, while those needing renovation sell at a discount. 

Buyers are rewarding quality and turnkey condition over age alone. Whether a cabin was built in 1995 or 2023, what matters most is how well it’s been maintained, updated, and positioned for rental success.


What This Means for Buyers and Sellers

For Buyers:
Inventory is still competitive, but opportunities remain especially for those ready before the winter slowdown. Rising prices show that waiting likely means paying more in the new year.


For Sellers:
This fall’s numbers favor listing now. Homes are taking only slightly longer to sell, and pricing power remains strong. Proper maintenance, updated finishes, and strong rental performance data can help command top-tier offers.


For Investors:
2025 continues to reward the data-driven investor. The most profitable STR properties are newer builds with proven amenities and solid management. With rental demand steady, now’s the time to refine your portfolio before next spring’s rush.


Whether you’re planning to buy, sell, or simply track your investment’s performance, our team is here to help you interpret the data and make confident decisions.

Ready to explore the numbers behind your next move? Contact the Jason White Team for a personalized market analysis or to see what’s currently available in the Smokies.


September 2025 Market Update: A Strong Finish to the Third Quarter in the Smokies

The Smoky Mountain real estate market wrapped up the third quarter on a high note.

Compared to this time last year, both home sales and total volume are up significantly, even as homes spend a little more time on the market.

If you’re an investor or homeowner tracking trends across Sevier County, here’s what the numbers tell us.


Residential Market Snapshot – September 2025 vs. 2024

Even with slightly longer market times, both sales and pricing increased. Total residential volume rose more than 30% compared to last September.


Single-Family Homes Lead the Market

Single-family homes and cabins remain the strongest segment of the market, with more homes selling at higher prices and total sales volume up 37% compared to last September.

Condos: A Softer but Still Active Segment

There were more condo sales this September than last year, but the average price and price per square foot both dropped significantly, while days on market increased sharply.


Land & Lots

More land parcels sold this September than last year, but the average sale price dropped sharply, and overall volume declined.


Year-to-Date Performance (January–September 2025)


Segment

Units Sold

Average Price

Avg. DOM

Price/Sq. Ft.

Residential (All)

704

$675,000 avg

77

$323 avg

Single-Family Homes

534

$711,000 avg

79

$325 avg

Condos

52

$357,000 avg

93

$280 avg

Land & Lots

226

$122,000 avg

88


Year-to-date, total market volume has surpassed $435 million, up roughly 12% from 2024’s pace.

Average sale prices have climbed throughout the year, while days on market have held steady, showing that the Smoky Mountain market remains active and balanced as we close the third quarter.


As we head into the final quarter of 2025:

  • Demand remains steady. September’s volume was the highest month of the year so far.

  • Inventory is tightening, which should help support prices through winter.

  • Single-family homes continue to dominate the market, representing more than 90% of residential sales and nearly all of September’s total sales volume.

  • Condos and land both saw an increase in the number of transactions but a decline in average price, suggesting buyers are gravitating toward smaller or lower-priced properties.

2025 has been a year of growth, balance, and strong investor confidence in the Smoky Mountain region.

While homes are taking a bit longer to sell, prices are rising and total sales volume continues to climb clear indicators of a resilient market.

If you’re considering buying or selling before year-end, now is the time to evaluate your position.


What This Means for You?

For Buyers:

Inventory is still moving, but at a steadier pace than last year.

Homes are spending a little more time on the market, which can work in your favor.

If you’ve been waiting for a moment to step in without competing against multiple offers, this fall offers more breathing room.


For Sellers:

Average prices and total sales volume continue to rise.

Well-priced, well-presented homes are still commanding strong offers. With buyer demand steady, now is the time to make sure your property stands out.

Presentation, pricing, and positioning matter more than ever.


For Investors:

The single-family segment remains the most consistent performer, driving nearly all market growth this year. If you’re building a short-term rental portfolio, focus on properties with strong location appeal and proven amenities, these are the listings still moving.

Land sales and lower-priced condos show that smaller investments are still finding buyers, a good sign of continued confidence in the Smoky Mountain market overall.


Reach out to The Jason White Team to review your property’s performance or explore new opportunities across Gatlinburg, Pigeon Forge, and Sevierville.

Tourism Dollars Keep Climbing: Why Sevier County Remains a Hot Spot for STRs

The latest numbers prove tourism is stronger than ever in Sevier County. 

In 2024, the industry generated $3.93 billion in spending, a 2.03% increase from 2023. 

These numbers are a signal of the long term opportunities for short term rental owners and potential buyers in the Smoky Mountain market. 


Tourism is the Economic Backbone of Sevier County

In 2024, visitor spending generated $251.7 million in state tax revenue and $187.2 million locally. 

Without tourism, each household here would be paying an extra $11,191 in taxes every year.

Not only is your rental property benefiting you as an investor, it supports local jobs, businesses, and public services. 

Sevier County ranked #3 in Tennessee for visitor spending out of 95 counties.


Tennessee Tourism is a National Standout

Tennessee’s tourism industry has been breaking records year after year.

In 2024 alone, the state welcomed 147 million visitors, generating $31.66 billion in direct visitor spending. 

That’s a 36.6% increase, since 2018, outpacing the national average of $17.4 billion.

International travel spending jumped 12% in 2024.

This means, for investors Tennessee is one of the strongest tourism markets in the nation, and Sevier County sits at the top! 


What’s Happening with Tourism in Pigeon Forge?

Looking at the latest Pigeon Forge tourism data gives us a window into visitor behavior that’s directly relevant to your rental strategy:

  • Gross Spending (June 2025): $251.8 million (down 3.3% YoY), with lodging up 5.18% YoY
  • Restaurants & Attractions: Both showing modest growth YoY
  • Visitor Profile Changes:

    • Average party size shrank from 3.3 to 3.0.
    • Average stay shortened from 2.7 to 2.4 nights.
    • First-time visitors surged from 36% to 49%

For short term rental property investors this means your property might be hosting smaller groups for shorter stays and potentially brand-new guests who are visiting the Smokies for the first time. 

Which means you, as a property owner, have a golden opportunity to turn first-time guests into repeat visitors! 


What to Expect Moving Forward?

Nationally, the U.S. economy has been a mix of progress and pressure:

Now more than ever flexible calendars, competitive pricing, and offering attractive last-minute availability and promotions are important. 


For property owners, now is the time to sharpen your marketing and create excellent guest experiences so that you can capture repeat business. 

For potential buyers, the steady growth in Sevier County is a sign that investing in the Smoky Mountain short-term rental market is a smart move!


The Smokies Remain a Top Investment Destination

From record-breaking tourism numbers to lodging growth, the Smoky Mountains continue to be one of the most reliable and profitable vacation rental markets in the country. 

Whether you already own a cabin or are considering your first investment, the message is clear: Sevier County tourism isn’t slowing down anytime soon

At the Jason White Team, we’ve been helping investors and homeowners navigate the Smoky Mountain real estate market since 1996. With deep local expertise and a passion for this community, we’re here to guide you toward making the most of the market.

📲 Ready to explore opportunities in short-term rentals? Let’s connect and find the right property for your investment goals.


Smoky Mountain Real Estate Market Update for August 2025

As summer winds down and we head into fall, the Smoky Mountain housing market is showing some interesting shifts. 

Whether you’re a homeowner, an investor, or thinking about buying your first property in the mountains, here’s what you need to know about where things stand as of August 2025.


Sales Are Slowing Down

Residential sales reached a high point in April with 87 homes sold, but activity has tapered since then. In August, 74 homes closed, which is about a 15% drop from the spring peak.

At the same time, properties are spending longer on the market. The average home took 108 days to sell in August, nearly twice as long as earlier this year. This tells us buyers are being more cautious, taking their time to make decisions.


Prices Are Holding Strong

Even though sales volume has slowed, home values remain steady.

  • The average residential price in August was $714,000.
  • Single-family homes averaged $745,000, one of the strongest months this year.

This is good news for sellers: buyers may be slower to act, but they’re still willing to pay for properties in desirable locations with strong rental or lifestyle appeal.


Single-Family Homes

This segment continues to drive the market:

  • 65 homes sold in August
  • Average price: $745,000
  • Price per square foot holding steady at $347

Condos

Condo sales remain a smaller portion of the market — only 5 closings in August — but the average price rose to $426,600. Condos are attracting fewer buyers right now, but when they do sell, they’re often closing at higher price points than earlier in the year.


Land

Vacant land continues to be the softest segment. In August, 22 lots sold, and average prices bounced between $112K–$146K over the past few months. Investors seem cautious about land purchases, likely due to rising building costs and longer timelines.


What This Means for You

  • For Sellers: Expect longer timelines. Homes are sitting on the market for a few extra months compared to earlier this year. The good news? Prices are still strong, especially for well-located, well-maintained properties.
  • For Buyers: With homes taking longer to sell, you may have more breathing room to negotiate and consider your options. While prices remain firm, you won’t feel the same urgency as in previous years.
  • For Investors: The single-family home market remains the safest bet for short-term rentals in the Smokies. Condos and land carry more risk in today’s market, but the right location and amenities can still deliver strong returns.


The Bottom Line

The Smoky Mountain real estate market is cooling in pace, not in price. Fewer properties are selling, and homes are taking longer to move, but values remain steady.

As always, location and amenities are key. A well-situated home near Gatlinburg, Pigeon Forge, or Sevierville will continue to hold value and adding guest-friendly features like hot tubs, game rooms, or mountain views will make your investment stand out.

If you’re considering buying or selling in the Smokies, now is the time to have a clear strategy. Our team has been guiding clients through every type of market since 1996, and we’d love to help you make your next move with confidence.

Ready to explore your options? Contact us today to talk about the opportunities waiting in the Smoky Mountains!