
Many things are uncertain right now and although we cannot predict what the future holds, we would like to provide you with some information about market movement during the month of May.


Year End Market Movement


Many things are uncertain right now and although we cannot predict what the future holds, we would like to provide you with some information about market movement during the month of April.


Many things are uncertain right now and although we cannot predict what the future holds, we would like to provide you with some information about market movement during the month of March.


We would also like to provide information about year to date market movement.


Sevier County Homes
354 homes sold in Sevier County during January and February of 2020.
282 homes sold during January and February of 2019.
Sales are up 26%.
Average price has increased by 18% and is up by $50,000.
Average price is $333,410.
Available Inventory is down 2%, and Volume up by 48%.
Gatlinburg
63 homes sold in Gatlinburg during January and February of 2020.
39 homes sold during January and February of 2019.
Sales are up by 62%.
Average price has increased by 16% and is up by $45,000.
Average price is $329,914.
Available Inventory is up 26%, and Volume is up 87%.
Pigeon Forge
79 homes sold in Pigeon Forge during January and February of 2020.
58 homes sold during January and February of 2019.
Sales are up 36%.
Average price has decreased by 2% and is down by $26,000.
Average price is $360,999.
Available Inventory is down 12%, and Volume up by 27%.
Sevierville
108 homes sold in Sevierville during January and February of 2020.
86 homes sold during January and February of 2019.
Sales are up by 26%.
Average price is up by 30%, and is up by $70,000
Average price is $306,708.
Available Inventory is up 3%, and Volume up 63%.
Wears Valley
25 homes sold in Wears Valley during January and February of 2020.
16 homes sold during January and February of 2019.
Sales are up by 56%.
Average price has increased by 32% and is up by $100,000.
Average price is $418,568.
Available Inventory is up 47%, and Volume has more than doubled.
Douglas Lake
4 homes sold on Douglas Lake during January and February of 2020.
7 homes sold during January and February of 2019.
Sales are down 43%.
Average price has increased by 65% and is up by $155,000.
Average price is $395,651.
Available Inventory is down 38%, and down up by 6%

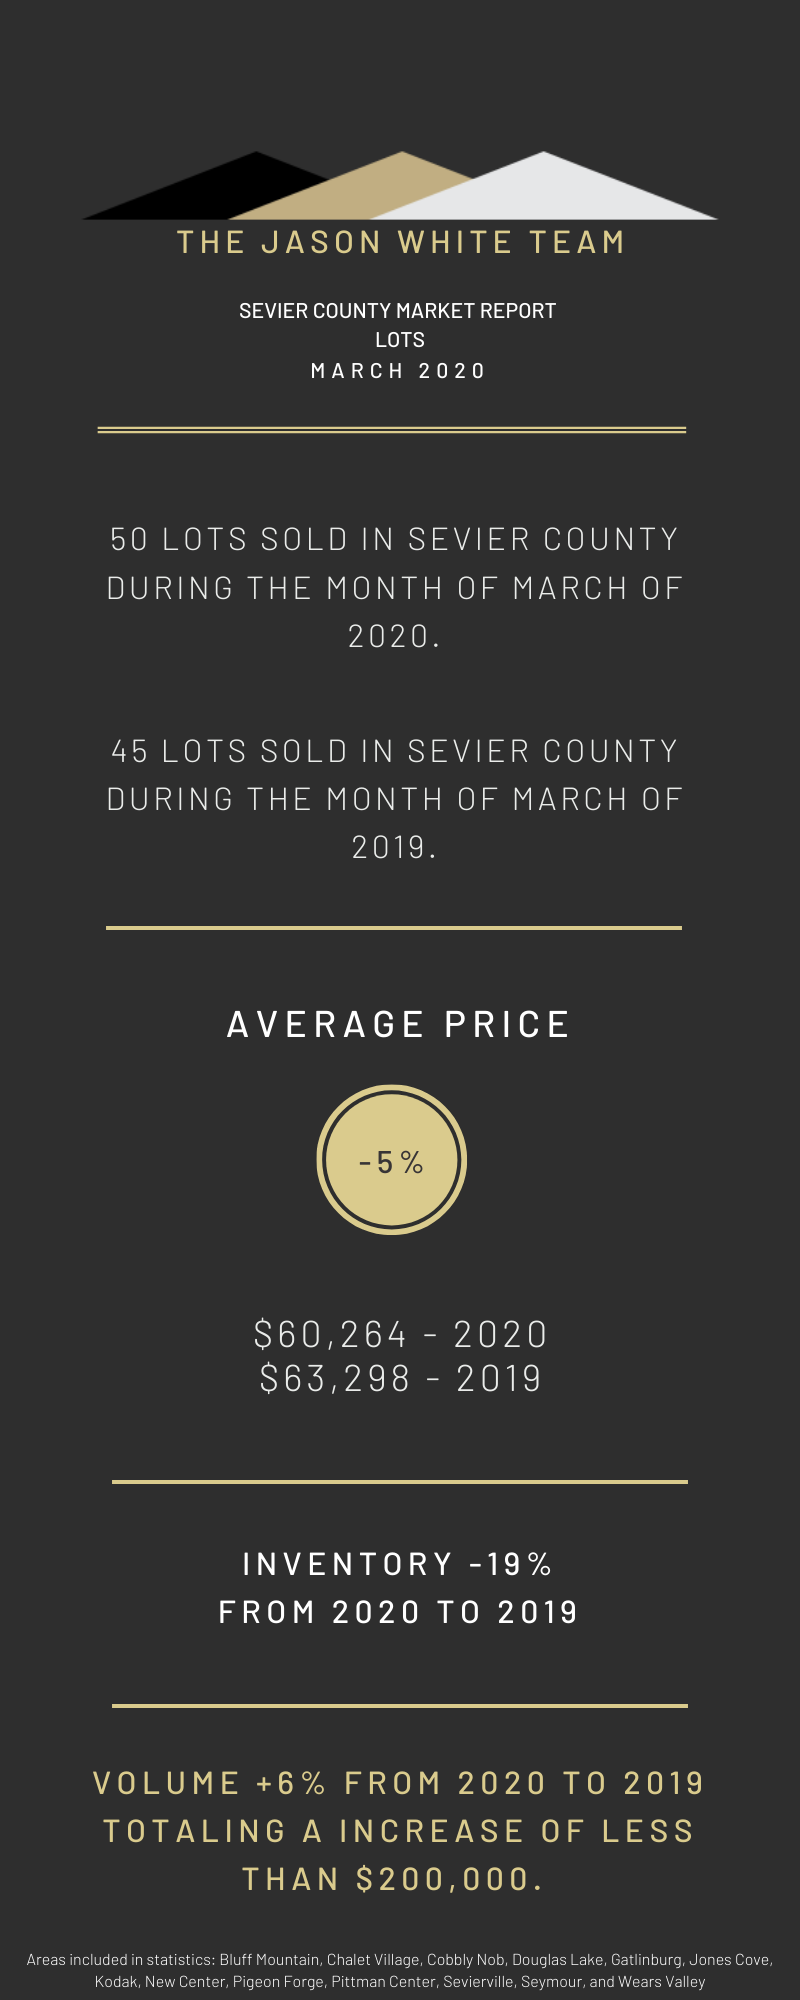
110 lots sold in Sevier County during January and February of 2020.
94 lots sold during January and February of 2019.
Sales are up by 17%.
Average price has decreased by 12% and is down by $6,000.
Average price is $51,255.
Available Inventory is down 16%, and Volume up by 3%.
18 lots sold in Gatlinburg during January and February of 2020.
25 lots sold during January and February of 2019.
Sales are down by 28%.
Average price has decreased by 9% and is up by $3,000.
Average price is $39,361.
Available Inventory is down 23%, and Volume down by 34%.
8 lots sold in Chalet Village during January and February of 2020.
9 lots sold during January and February of 2019.
Sales are down by 11%.
Average price is up by 27% and is up by $13,000.
Average price is $59,687.
Available Inventory is down by 7%, and Volume up by 13%.
10 lots sold in Pigeon Forge during January and February of 2020.
14 lots sold during January and February of 2019.
Sales are down by 29%.
Average price is flat.
Average price is $23,130.
Available Inventory is down 35%, and Volume down by 29%.

183 homes sold in Sevier County during January of 2020.
145 homes sold during January of 2019.
Sales are up 26%.
Average price has increased by 17% and is up by $49,000.
Average price is $337,135.
Available Inventory is down 2%, and Volume up by 48%.
36 homes sold in Gatlinburg during January of 2020.
18 homes sold during January of 2019.
Sales doubled.
Average price has increased by 4% and is up by $12,000.
Average price is $328,759.
Available Inventory is up 24%, and Volume is up 108%.
41 homes sold in Pigeon Forge during January of 2020.
29 homes sold during January of 2019.
Sales are up 41%.
Average price has decreased by 9% and is down by $35,000.
Average price is $367,261.
Available Inventory is up 12%, and Volume up by 29%.
53 homes sold in Sevierville during January of 2020.
43 homes sold during January of 2019.
Sales are up by 23%.
Average price is up by 35%, and is up by $82,000
Average price is $318,835.
Available Inventory is up 1%, and Volume up 66%.
11 homes sold in Wears Valley during January of 2020.
139 homes sold during January of 2019.
Sales are down by 15%.
Average price has increased by 18% and is up by $56,000.
Average price is $369,809.
Available Inventory is down 3%, and Volume is flat.
4 homes sold on Douglas Lake during January of 2020.
3 homes sold during January of 2019.
Sales are up 33%.
Average price has increased by 116% and is up by $212,000.
Average price is $395,651.
Available Inventory is down 30%, and Volume up by 188%

47 lots sold in Sevier County during January of 2020.
42 lots sold during January of 2019.\
Sales are up by 12%.
Average price has decreased by 35% and is down by $25,000.
Average price is $47,140.
Available Inventory is down 14%, and Volume down by 27%.
7 lots sold in Gatlinburg during January of 2020.\
10 lots sold during January of 2019.
Sales are down by 30%.
Average price has increased by 69% and is up by $17,000.
Average price is $43,857.
Available Inventory is down 23%, and Volume up by 19%.
2 lots sold in Chalet Village during January of 2020.
5 lots sold during January of 2019.
Sales are down by 60%.
Average price is down by 28% and is down by $13,000.
Average price is $36,000.
Available Inventory is down by 10%, and Volume down by 71%.
5 lots sold in Pigeon Forge during January of 2020.
3 lots sold during January of 2019.
Sales are up 67%.
Average price has increased by 32% and is up by $26,000.
Average price is $22,360.
Available Inventory is down 35%, and Volume up by 32%.

2181 homes sold in Sevier County from January to December of 2019.
2085 homes sold from January to December of 2018.
Sales are up 5%.
Average price has increased by 12% and is up by $29,000.
Average price is $289,255.
Available Inventory is down 3%, and Volume up by 17%.
352 homes sold in Gatlinburg from January to December of 2019.
347 homes sold from January to December of 2018.
Sales are up by 1%.
Average price has increased by 18% and is up by $45,000.
Average price is $305,174.
Available Inventory is down 4%, and Volume is up 19%.
378 homes sold in Pigeon Forge from January to December of 2019.
395 homes sold from January to December of 2018.
Sales are down by 4%.
Average price has increased by 17% and is up by $49,000.
Average price is $338,198.
Available Inventory is flat, and Volume up by 12%.
*7 homes have been sold for over $1M in Pigeon Forge this year.
668 homes sold in Sevierville from January to December of 2019.
612 homes sold from January to December of 2018.
Sales are up by 9%.
Average price is up by 3%.
Average price is $260,531.
Available Inventory is up 2%, and Volume up 13%.
118 homes sold in Wears Valley from January to December of 2019.
139 homes sold from January to December of 2018.
Sales are down by 15%.
Average price has increased by 18% and is up by $56,000.
Average price is $369,809.
Available Inventory is down 3%, and Volume is flat.
63 homes sold on Douglas Lake from January to December of 2019.
59 homes sold from January to December of 2018.
Sales are up 7%.
Average price has increased by 11% and is up by $33,000.
Average price is $344,068.
Available Inventory is down 9%, and Volume up 18%

676 lots sold in Sevier County from January to December of 2019.
558 lots sold from January to December of 2018.
Sales are up by 21%.
Average price has increased by 18% and is up by $9,000.
Average price is $64,099.
Available Inventory is down 7%, but Volume up by 43%.
159 lots sold in Gatlinburg from January to December of 2019.
108 lots sold from January to December of 2018.
Sales are up by 39%.
Average price has increased by 39% and is up by $16,000.
Average price is $59,360.
Available Inventory is down 4%, and Volume up by 104%.
50 lots sold in Chalet Village from January to December of 2019.
41 lots sold from January to December of 2018.
Sales are up by 22%.
Average price is up by 28% and is up by $13,000.
Average price is $61,465.
Available Inventory is up 3%, and Volume up 56%.
81 lots sold in Pigeon Forge from January to December of 2019.
57 lots sold from January to December of 2018.
Sales are up 42%.
Average price has increased by 30% and is up by $13,000.
Average price is $56,639.
Available Inventory is down 13%, and Volume up by 85%.

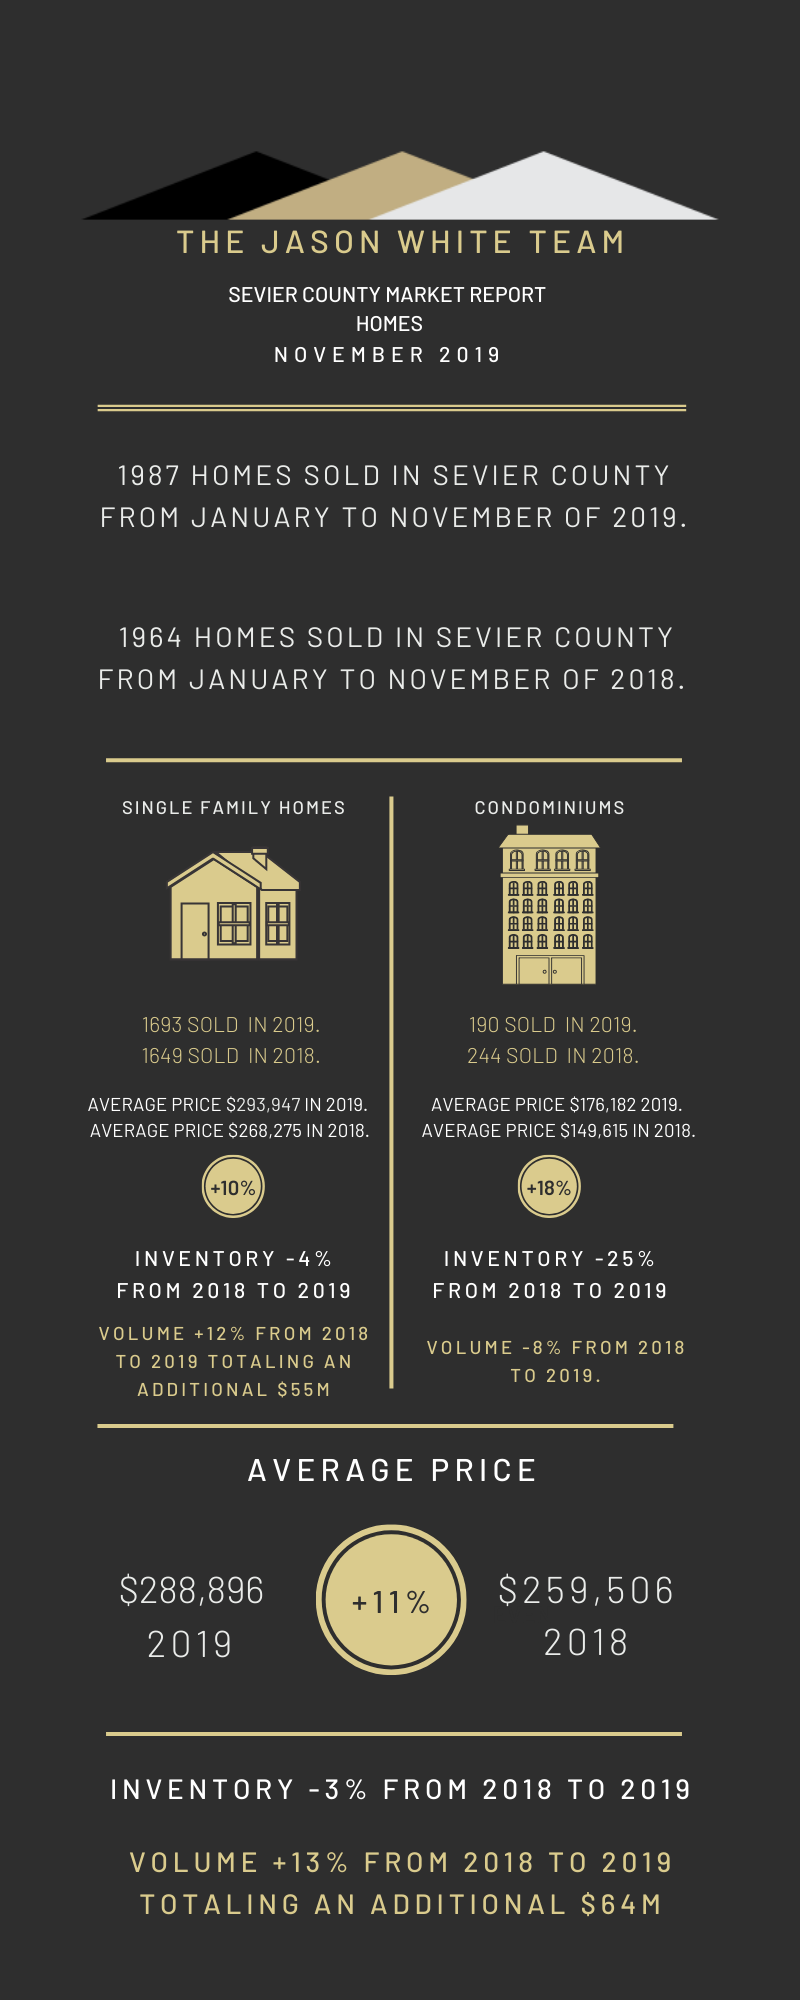
1987 homes sold in Sevier County from January to November of 2019.
1964 homes sold from January to November of 2018.
Sales are up 1%.
Average price has increased by 11% and is up by $29,000.
Average price is $288.896.
Available Inventory is down 3%, and Volume up by 13%.
309 homes sold in Gatlinburg from January to November of 2019.
326 homes sold from January to November of 2018.
Sales are down by 5%.
Average price has increased by 19% and is up by $49,000.
Average price is $308,482.
Available Inventory is down 5%, and Volume is up 13%.
349 homes sold in Pigeon Forge from January to November of 2019.
375 homes sold from January to November of 2018.
Sales are down by 7%.
Average price has increased by 18% and is up by $51,000.
Average price is $338,487.
Available Inventory is down 2%, and Volume up by 10%.
*7 homes have been sold for over $1M in Pigeon Forge this year.
608 homes sold in Sevierville from January to November of 2019.
579 homes sold from January to November of 2018.
Sales are up by 5%.
Average price is up by 3%.
Average price is $259,838.
Available Inventory is down 1%, and Volume up 8%.
107 homes sold in Wears Valley from January to November of 2019.
132 homes sold from January to November of 2018.
Sales are down by 19%.
Average price has increased by 15% and is up by $46,000.
Average price is $361,854.
Available Inventory is down 5%, and Volume down by 7%.
63 homes sold on Douglas Lake from January to November of 2019.
58 homes sold from January to November of 2018.
Sales are up 9%.
Average price has increased by 10% and is up by $30,000.
Average price is $344,068.
Available Inventory is down 5%, and Volume up 19%

626 lots sold in Sevier County from January to November of 2019.
508 lots sold from January to November of 2018.
Sales are up by 23%.
Average price has increased by 23% and is up by $11,000.
Average price is $64,132.
Available Inventory is down 8%, but Volume up by 51%.Gatlinburg
149 lots sold in Gatlinburg from January to November of 2019.
99 lots sold from January to November of 2018.
Sales are up by 51%.
Average price has increased by 31% and is up by $12,000.
Average price is $54,402.
Available Inventory is down 5%, and Volume up by 97%.
45 lots sold in Chalet Village from January to November of 2019.
37 lots sold from January to November of 2018.
Sales are up by 22%.
Average price is up by 21% and is up by $10,000.
Average price is $59,338.
Available Inventory is up 3%, and Volume up 48%.
74 lots sold in Pigeon Forge from January to November of 2019.
56 lots sold from January to November of 2018.
Sales are up 32%.
Average price has increased by 37% and is up by $16,000.
Average price is $60,323.
Available Inventory is down 14%, and Volume up by 81%.

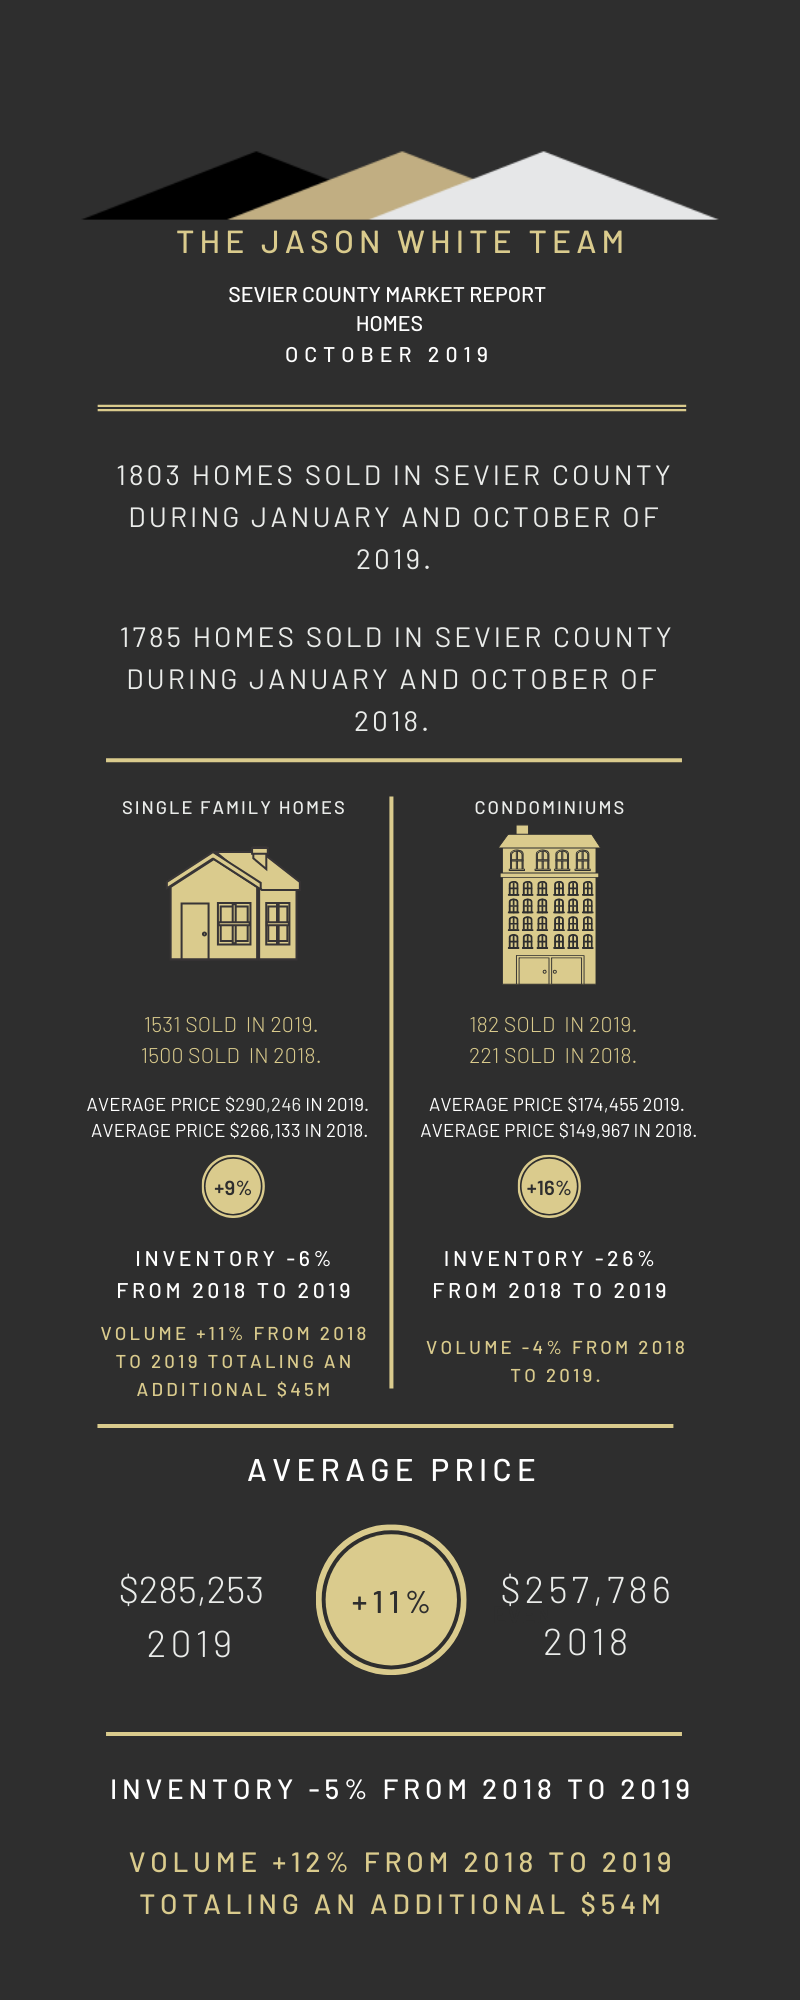
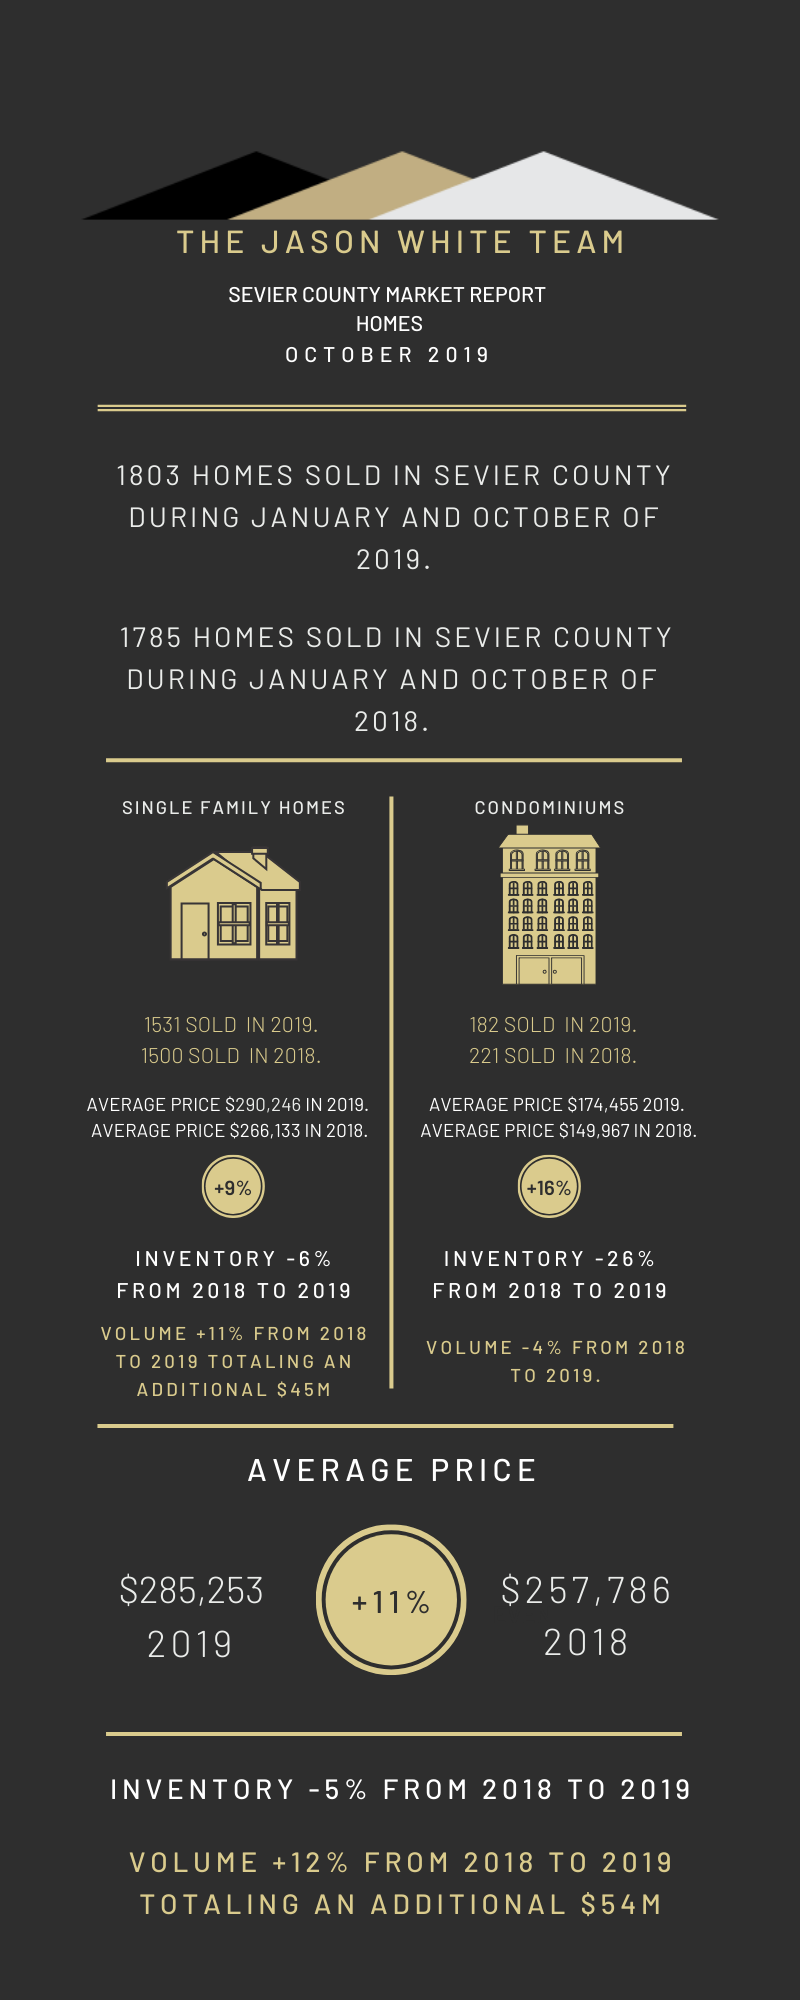
1803 homes sold in Sevier County during January and October of 2019.
1785 homes sold during January and October of 2018.
Sales are up 1%.
Average price has increased by 11% and is up by $27,000.
Average price is $285,253.
Available Inventory is down 5%, and Volume up by 12%.
282 homes sold in Gatlinburg during January and October of 2019.
291 homes sold during January and October of 2018.
Sales are down by 3%.
Average price has increased by 17% and is up by $44,000.
Average price is $298,910.
Available Inventory is down 7%, and Volume is up 14%.
305 homes sold in Pigeon Forge during January and October of 2019.
335 homes sold during January and October of 2018.
Sales are down by 9%.
Average price has increased by 18% and is up by $52,000.
Average price is $339,830.
Available Inventory is down 4%, and Volume up by 8%.
*7 homes have been sold for over $1M in Pigeon Forge this year.
549 homes sold in Sevierville during January and October of 2019.
537 homes sold during January and October of 2018.
Sales are up by 2%.
Average price is up by 2%.
Average price is $257,512.
Available Inventory is down 2%, and Volume up 4%.
100 homes sold in Wears Valley during January and October of 2019.
121 homes sold during January and October of 2018.
Sales are down by 17%.
Average price has increased by 15% and is up by $46,000.
Average price is $355,794.
Available Inventory is down 7%, and Volume down by 5%.
57 homes sold on Douglas Lake during January and October of 2019.
52 homes sold during January and October of 2018.
Sales are up 10%.
Average price has increased by 15% and is up by $44,000.
Average price is $337,514.
Available Inventory is down 5%, and Volume up 26%

570 lots sold in Sevier County during January and October of 2019.
456 lots sold during January and October of 2018.
Sales are up by 25%.
Average price has increased by 21% and is up by $11,000.
Average price is $63,890.
Available Inventory is down 8%, but Volume up by 51%.
142 lots sold in Gatlinburg during January and October of 2019.
87 lots sold during January and October of 2018.
Sales are up by 63%.
Average price has increased by 27% and is up by $11,000.
Average price is $53,873.
Available Inventory is down 1%, and Volume up by 108%.
45 lots sold in Chalet Village during January and October of 2019.
36 lots sold during January and October of 2018.
Sales are up by 25%.
Average price is up by 19% and is up by $9,000.
Average price is $59,338.
Available Inventory is up 3%, and Volume up 49%.
69 lots sold in Pigeon Forge during January and September of 2019.
51 lots sold during January and October of 2018.
Sales are up 35%.
Average price has increased by 46% and is up by $19,000.
Average price is $61,926.
Available Inventory is down 15%, and Volume up by 97%.

Sevier County Homes
1600 homes sold in Sevier County during January and September of 2019.
1589 homes sold during January and August of 2018.
Sales are up 1%.
Average price has increased by 10% and is up by $26,000.
Average price is $283,467.
Available Inventory is down 6%, and Volume up by 11%.
Gatlinburg
254 homes sold in Gatlinburg during January and September of 2019.
256 homes sold during January and August of 2018.
Sales are down by 1%.
Average price has increased by 16% and is up by $39,000.
Average price is $294,461.
Available Inventory is down 14%, and Volume is up 4%.
Pigeon Forge
270 homes sold in Pigeon Forge during January and September of 2019.
303 homes sold during January and August of 2018.
Sales are down by 11%.
Average price has increased by 22% and is up by $62,000.
Average price is $346,731.
Available Inventory is down 5%, and Volume up by 9%.
*7 homes have been sold for over $1M in Pigeon Forge this year.
Sevierville
491 homes sold in Sevierville during January and September of 2019.
477 homes sold during January and August of 2018.
Sales are up by 3%.
Average price is up by 1%.
Average price is $254,928.
Available Inventory is down 4%, and Volume up 4%.
Wears Valley
88 homes sold in Wears Valley during January and September of 2019.
106 homes sold during January and August of 2018.
Sales are down by 17%.
Average price has increased by 15% and is up by $45,000.
Average price is $356,341.
Available Inventory is down 12%, and Volume down by 5%.
Douglas Lake
52 homes sold on Douglas Lake during January and September of 2019.
49 homes sold during January and August of 2018.
Sales are up 6%.
Average price has increased by 17% and is up by $47,000.
Average price is $327,275.
Available Inventory is down 6%, and Volume up 24%

Sevier County Lots
491 lots sold in Sevier County during January and September of 2019.
413 lots sold during January and August of 2018.
Sales are up by 19%.
Average price has increased by 15% and is up by $8,000.
Average price is $62,115.
Available Inventory is down 9%, but Volume up by 37%.
Gatlinburg
128 lots sold in Gatlinburg during January and September of 2019.
76 lots sold during January and August of 2018.
Sales are up by 68%.
Average price has increased by 27% and is up by $11,000.
Average price is $54,570.
Available Inventory is down 1%, and Volume up by 144%.
Chalet Village
39 lots sold in Chalet Village during January and September of 2019.
29 lots sold during January and August of 2018.
Sales are up by 34%.
Average price is up by 4% and is up by $1,000.
Average price is $56,814.
Available Inventory is flat, and Volume up 39%.
Pigeon Forge
54 lots sold in Pigeon Forge during January and September of 2019.
51 lots sold during January and August of 2018.
Sales are up 6%.
Average price has increased by 41% and is up by $17,000.
Average price is $60,047.
Available Inventory is down 18%, and Volume up by 50%.
