
We track the local market month by month so our clients always know where things stand. Here is what the numbers from January through June 2026 are telling us.
The Market Is Building Momentum
Total residential sale volume more than doubled over the first half of the year, climbing from $28.3 million in January to $81.4 million in June. Closed sales followed the same path, rising from 51 in January to 117 in June.
Days on market tells a similar story. Homes averaged 145 days on market in January and dropped to 63 by March. After a small rise in April and May, days on market settled at 70 in June.
Buyers moved faster as the year went on, and sellers who priced well were rewarded with quicker closings.
Price per square foot gives us a cleaner read on appreciation than average price alone, since it is less affected by the mix of homes selling in a given month. That number climbed steadily all year, from $304 in January to $436 in June, a 43 percent increase in just five months.
How Bedroom Count Shapes Value
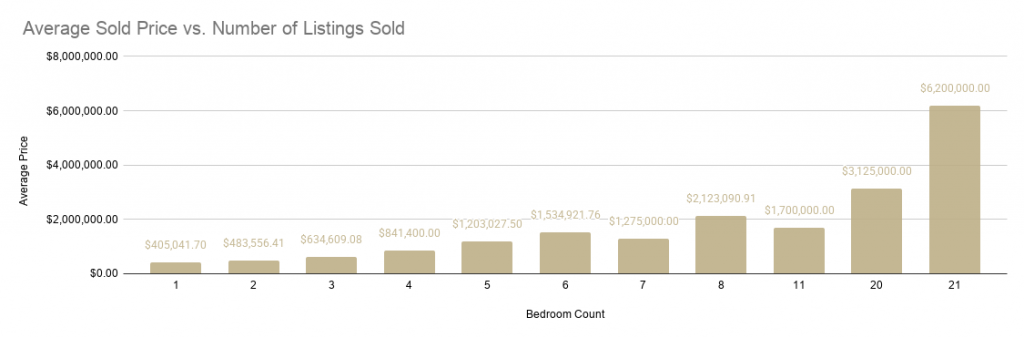
Looking at 485 closed sales, the pattern is clear. One bedroom properties averaged $405,041. Two bedroom properties averaged $483,556. Three bedroom properties averaged $634,609. Four bedroom properties averaged $841,400. Five bedroom properties averaged $1,203,027. Each additional bedroom brings a meaningful jump in price, at least through the five bedroom mark.
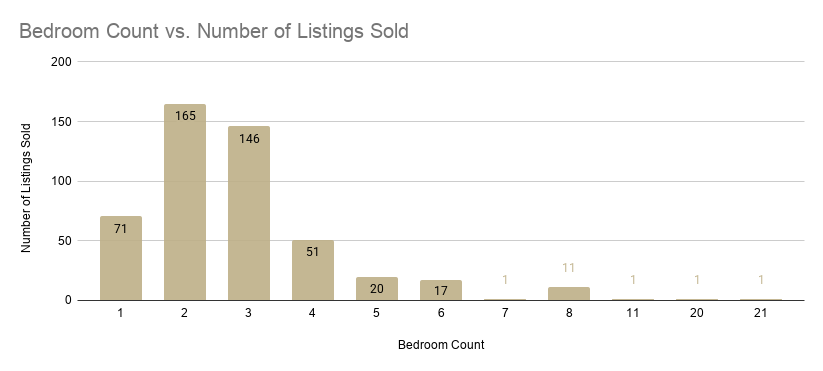
Two and three bedroom properties are where most of the activity happens. Together they account for 311 of the 485 sales in this dataset, which is well over half the market. If you are shopping for an investment property or trying to understand comparable sales, this is the segment with the deepest pool of data.
Above five bedrooms, the data is harder to draw conclusions from. There were only one or two sales in several of the larger bedroom categories, including the standout twenty one bedroom property that closed at $6.2 million. These larger properties show what is possible at the top of the market, but with so few sales in each category, there isn’t a way to pull trends.
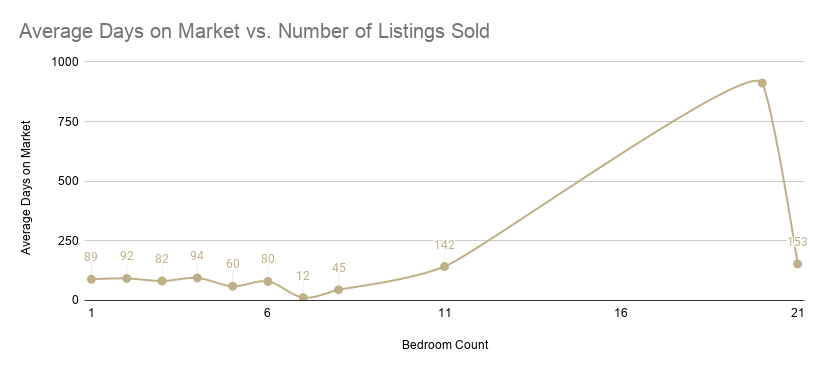
Surprisingly, days on market did not climb along with bedroom count. One to four bedroom properties, the segment most buyers are shopping in, spent an average of 82 to 94 days on market. Five, six, and eight bedroom properties moved faster, in the range of 45 to 80 days. Larger properties in this dataset were not sitting any longer than smaller ones, and in some cases they sold faster, potentially because buyers at that price point tend to be experienced investors who move with confidence once they find the right property.
New Construction Is Commanding a Premium
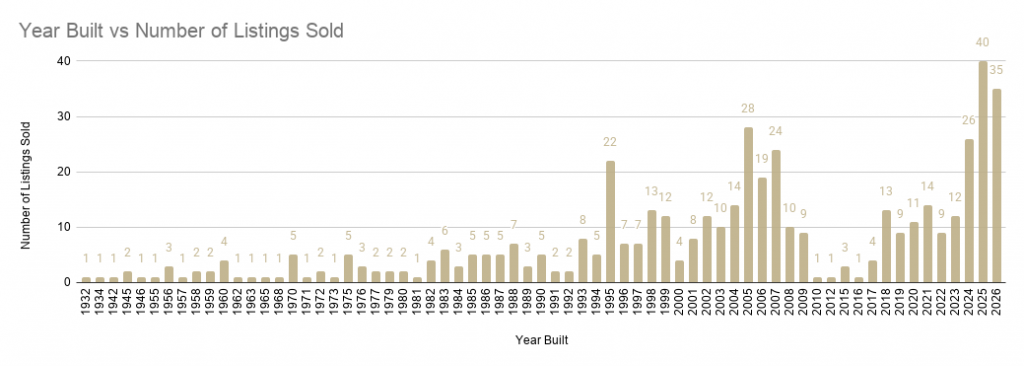
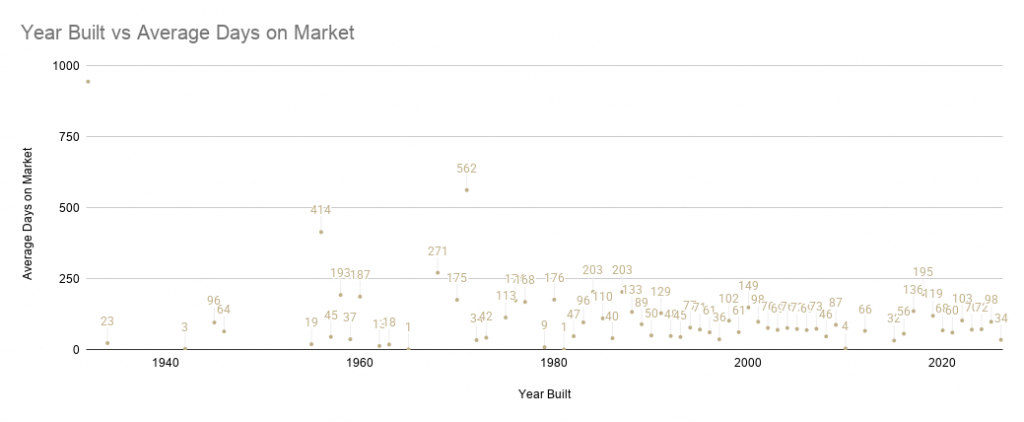
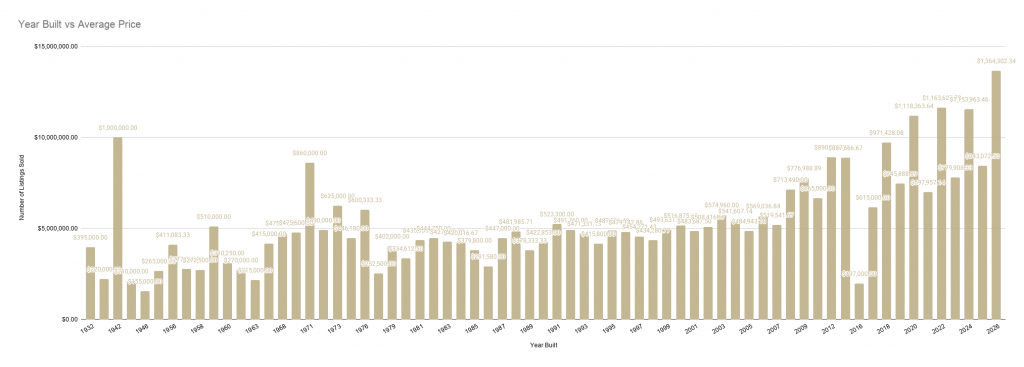
The build year data tells an equally compelling story. Properties built in 2026 averaged $1,364,302 and sold in just 34 days, the fastest average sale time of any meaningful year group in the dataset. Properties built in 2024 followed a similar pattern, averaging $1,153,963 with an average of 72 days on market.
2025 stands out for a different reason. It had the highest sale count of any year in the data, 40 closed sales, though the average price was lower at $843,072 and the average days on market was longer at 98 days. This likely reflects a wider range of inventory that year, appealing to a broader group of buyers rather than the luxury segment alone.
Zoom out and a clear shift appears around 2018. Before that year, most annual averages sit between $400,000 and $600,000, with only a handful of sales per year. From 2018 forward, both price and sale volume rise steadily, and from 2020 through 2026 the norm is well above $700,000, often crossing $1 million.
Older properties built before 2000 tell a more varied story. With only a few sales in most of those years, single properties can swing the average considerably. One home built in 1932 sat on the market for 944 days before closing, while a property built in 1942 sold in just 3 days. These older homes still find buyers, but their outcomes depend far more on individual property condition and pricing than on the year alone.
Single Family Cabins Are Leading the Way
Single family and cabin properties made up 90 percent or more of total residential volume in every month we tracked.
Sales rose from 45 in January to 100 in June, and price per square foot rose from $305 to $359, an 18 percent gain.
That is a more moderate increase than the overall market figure, which tells us the blended number is getting an extra lift from smaller segments of the market.
Condos and Land Moved to Their Own Rhythm
Condo sales stayed small all year, only 2 to 11 closings per month, and the numbers moved accordingly.
Average price bounced between $234,500 and $451,333 depending on the month, and days on market ranged from 30 to 139.
Price per square foot for condos actually eased slightly over the period, from $358 down to $276, the opposite direction of the cabin segment.
With sample sizes this small, we would caution against reading too much into any single month, but it is a segment worth watching as more inventory comes online.
Land sales held fairly steady, ranging from 12 to 23 lots per month.
Average price was choppy, peaking at $179,564 in February and settling near $140,726 by May, essentially flat despite rising home prices.
Days on market for land bounced between 85 and 183 days, a reminder that raw land moves on a different timeline than finished homes.
What This Means for You
The first half of 2026 has been a season of steady, meaningful growth for single family and cabin properties across the Smoky Mountains.
If you are considering listing your property or looking for your next investment, this is a market rewarding sellers who price accurately and buyers who move with confidence.
We have tracked this market for decades, and we would love to walk you through what these trends mean for your specific goals.