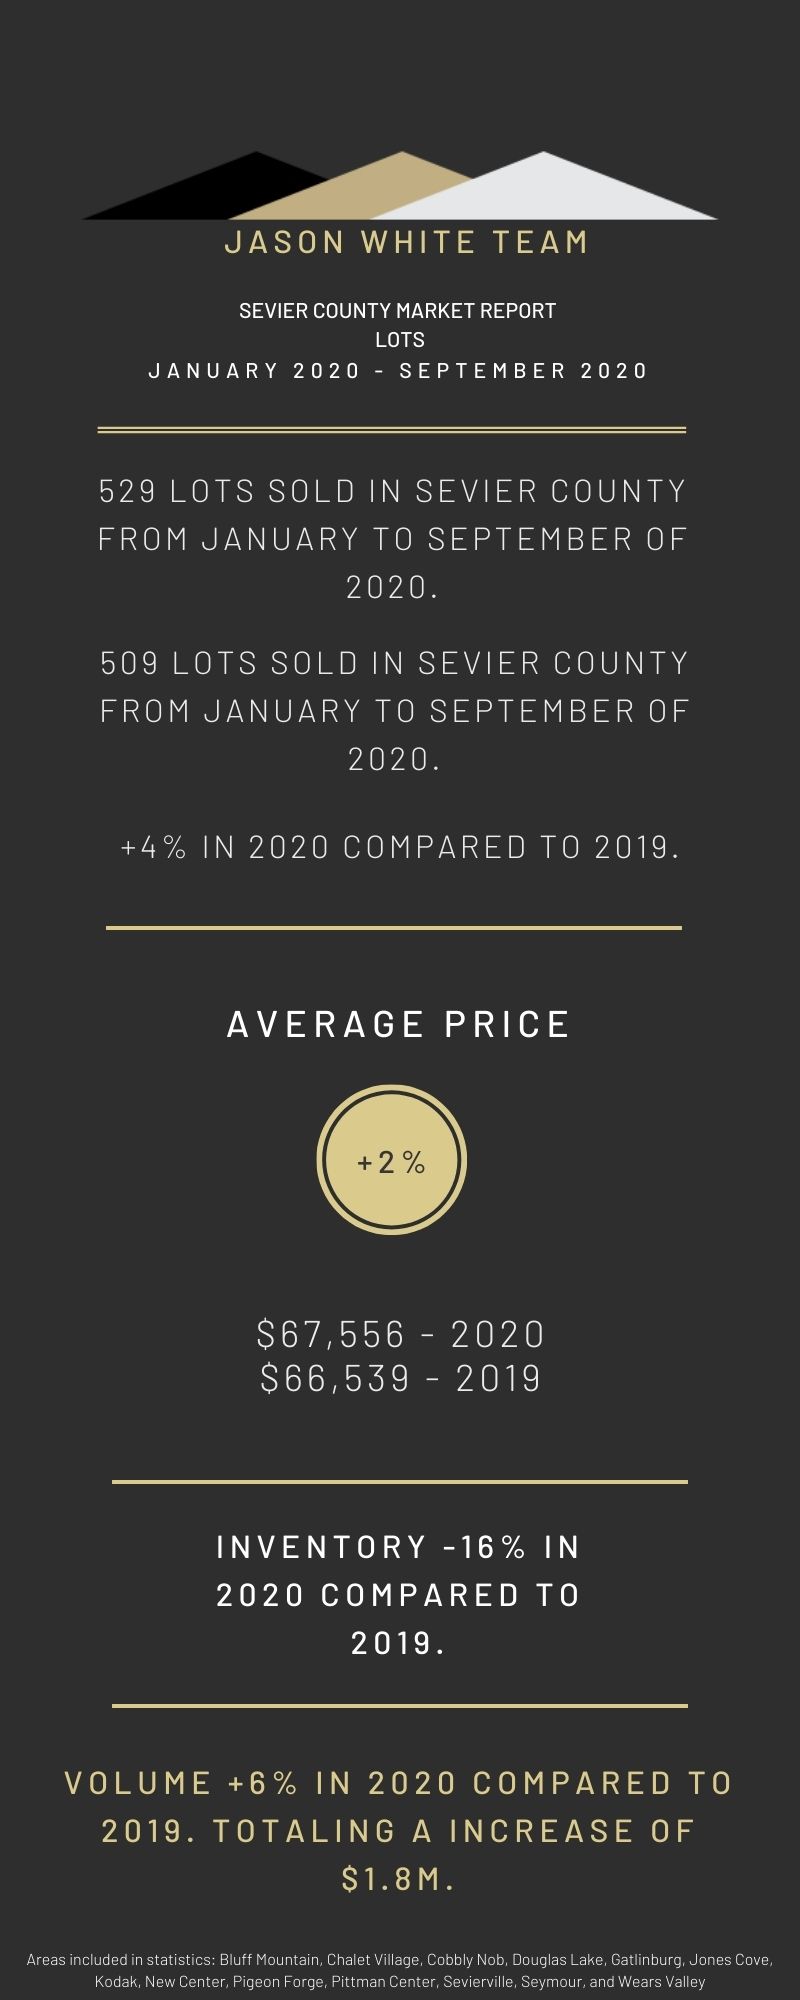
Market Movement During August 2020

Below is information about our market’s movement during the month of August. Notice that average price continues to increase, +13% for single family homes and +5% for land, while we continue to decline in inventory.

Prices are high and inventory is low, if you are think now might be the time to sell we’d love to help you determine the value of your property.

August 2020 Residential Real Estate Market Statistics


August 2020 Land Real Estate Market Statistics


Market Movement During July 2020

Below is information about our markets movement during the month of July. Notice that average price continues to increase, +24% for single family homes and +8% for land, while we continue to decline in inventory.

July 2020 Residential Real Estate Market Statistics


July 2020 Land Real Estate Market Statistics


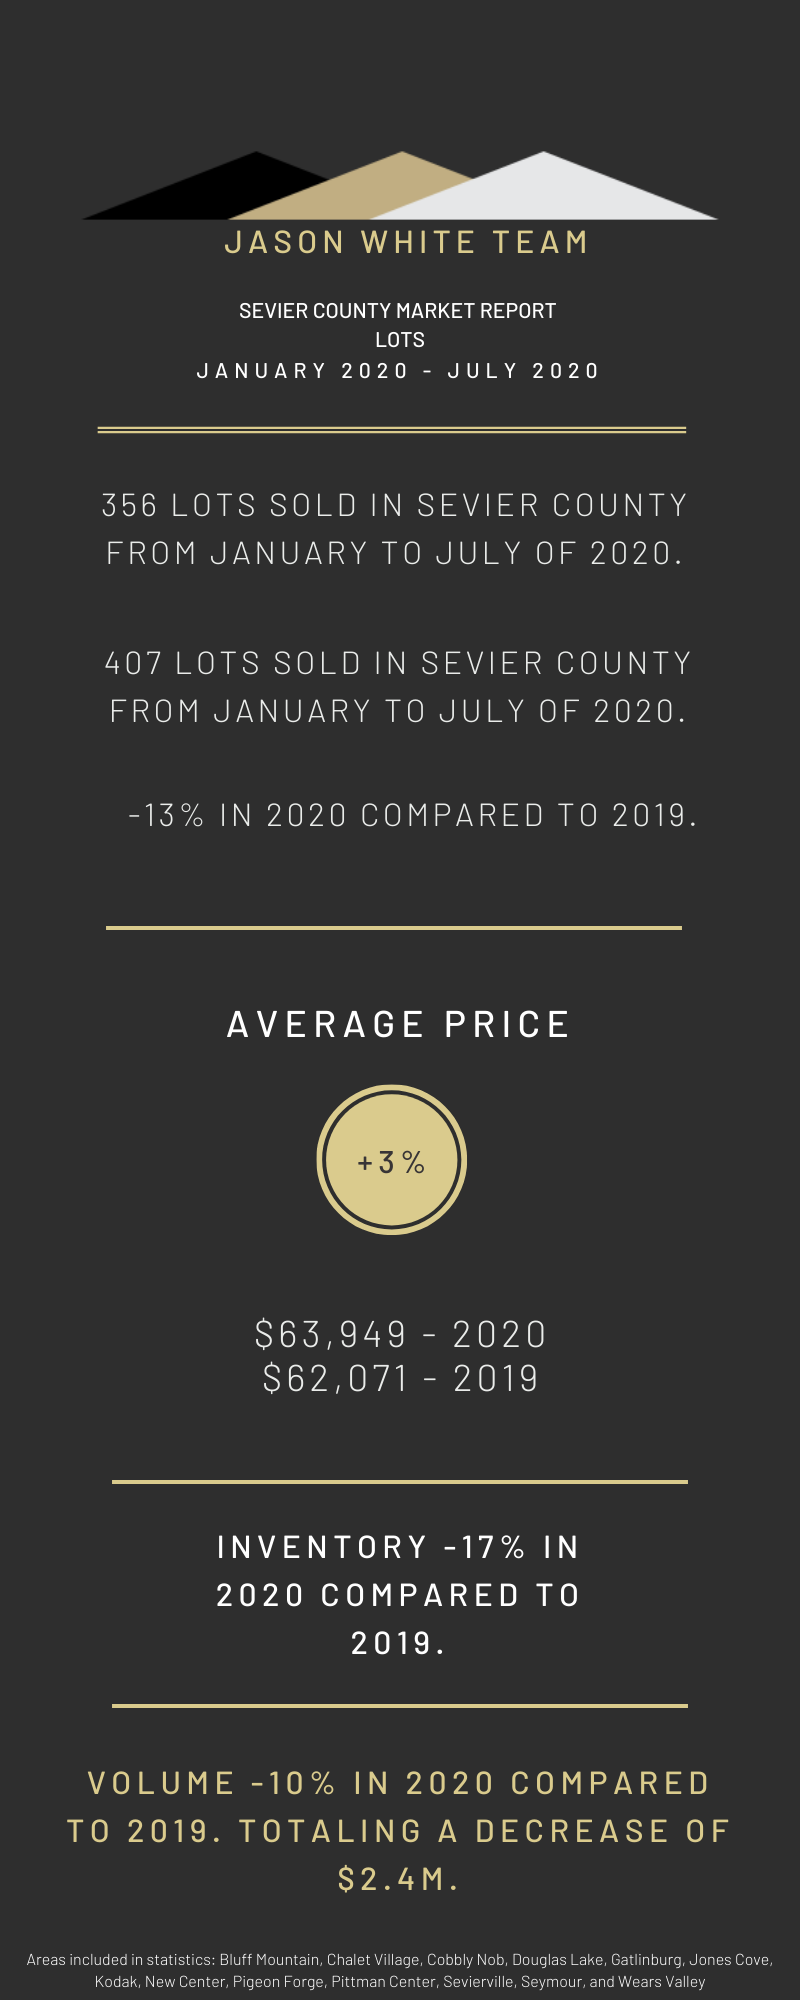
Here is information about year to date market movement.

July 2020 Residential Real Estate Market Statistics


Year to Date July 2020 Land Real Estate Market Statistics

Days on Market & Price per square footage breakdown by bedrooms

The charts below represent price per square foot and days on market data broken down by number of bedrooms for Sevier County from May 2019 – March 2020.

Soon, we’ll provide data that includes Quarter 2 days on market and average price per square foot, which will provide year over year comparison.

Price per Square Foot

Days on Market


Below are a few articles about the national market movement.

“Home buying optimism soars in latest Fannie Mae survey”

“Home loans have never been cheaper, if you can find a willing lender.”

Market Movement during June 2020

Below is information about our markets movement during the month of June. Notice that average price continues to increase, +24% for single family homes and +26% for land, while we continue to decline in inventory.

If you think now may be the right time for you to sell, we’d love to help you determine what your home or piece of land might be worth.

June 2020 Residential Market Movement
June 2020 Land Market Movement


Year to Date Market Movement

Year to Date Residential Market Movement
Year End Land Market Movement

CBS News ranks every National Park in the US by Popularity

Guess where the Great Smoky Mountains ended up on CBS’s list of most popular National Parks?

#1

The Smokies continue to be the most visited National Park.

“America’s most visited national park, Great Smoky Mountains straddles Tennessee and North Carolina, and features everything from mountains and waterfalls to hiking trails and historical attractions. Most visitors enter the park through Sevier County, Tennessee, and while there, many make a stop at Dollywood. Dolly Parton’s theme park draws 3 million people every year, and its success goes hand in hand with the success of the park.”

This comes with other perks too, not only did Sevierville land on FortuneBuilders Best Places to Buy Vacation Rental Property in 2020 so did Gatlinburg!

Tennessee’s No. 2 Industry – Tourism

We think its nice to see the data that supports the growth we see in our community. We’ll share information from the state below. We are working diligently with local government entities to provide more granular information specific to each city.

The Tennessee Vacation Industry produces an annual report  detailing the Department of Tourism Developments initiatives. This report runs from July to June, the most up to date report is from July 2018 to June 2019. Fiscal 2020 will be release sometime in September, per the previous years release.

“As Tennessee’s No. 2 industry, tourism has had another exceptional year, continuing to break visitation records and exceed economic impact numbers year over year. Tennessee’s skyrocketing growth is due in great part to key tourism partners throughout the state who invest in new attractions, groundbreaking expansions and important improvements.”


Tourism: Tennessee’s Economic Growth Engine , states “The results are undeniable:tourism is working in Tennessee. As the state’s leading service industry, tourism generated a record $1.81B in state and local tax revenues in 2018.”


We look forward to providing local data as it becomes available to us!

Market Movement During May 2020

Many things are uncertain right now and although we cannot predict what the future holds, we would like to provide you with some information about market movement during the month of May.


May 2020 Residential Real Estate Market Statistics


May 2020 Land Real Estate Market Statistics


Year End Market Movement

Year to Date April 2020 Residential Market Statistics


Year to Date April 2020 Land Market Statistics

April 2020 Real Estate Market Statistics

Many things are uncertain right now and although we cannot predict what the future holds, we would like to provide you with some information about market movement during the month of April.

April 2020 Residential Market Statistics


April 2020 Land Market Statistics


March 2020 Sevier County Real Estate Market Statistics

Many things are uncertain right now and although we cannot predict what the future holds, we would like to provide you with some information about market movement during the month of March.

March 2020 Residential Market Statistics
March 2020 Land Real Estate Statistics


We would also like to provide information about  year to date market movement.


Year to Date Residential Market Statistics
Year to Date Land Market Statistics