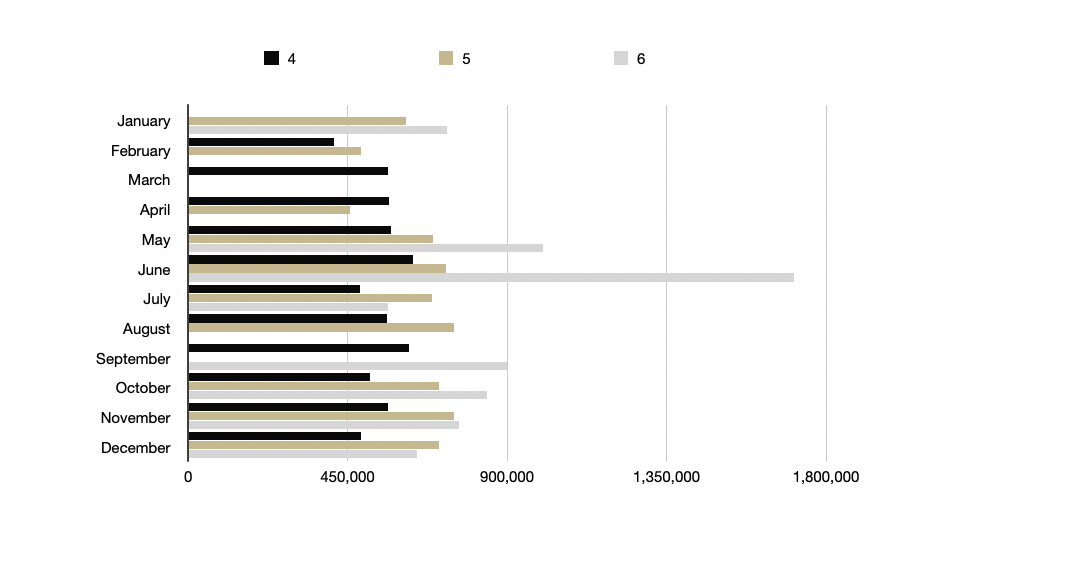
2020 Market Statistics For Pigeon Forge

2020 Year-End Real Estate Market Statistics specific to residential sales in Pigeon Forge

Average Price per Square Foot

Notice the spike in average price per square foot during March and September.
Average price stayed between $180 and $220 throughout the remainder of the year.

Pigeon Forge - Total Average Price
Pigeon Forge – Total Average Price
Pigeon Forge - Average Price Bedrooms 1-3
Pigeon Forge – Average Price Bedrooms 1-3


Pigeon Forge - Average Price Bedrooms 4-6
Pigeon Forge – Average Price Bedrooms 4-6
Pigeon Forge - Average Price Total and Bedrooms 1-6
Pigeon Forge – Average Price Total and Bedrooms 1-6


Days on Market

Days on market dipped from February to May and peaked during October and November.

Pigeon Forge - Days on Market Total
Pigeon Forge – Days on Market Total


Pigeon Forge - Days on Market (Bedroom 1-3)
Pigeon Forge – Days on Market (Bedroom 1-3)
Pigeon Forge - Days on Market (Bedroom 4-6)
Pigeon Forge – Days on Market (Bedroom 4-6)


Pigeon Forge - Days on Market (Total and Bedrooms 1-6)
Pigeon Forge – Days on Market (Total and Bedrooms 1-6)

2020 Year-End Real Estate Market Statistics specific to residential sales in Gatlinburg

Gatlinburg Information

Average Price

Despite the outlier in June – notice the increase during the 4th quarter.

Total Average Price - 2020 Year End Real Estate Gatlinburg
Total Average Price – 2020 Year End Real Estate Gatlinburg
Average Price (Bedrooms 1 -3) 2020 Year End Real Estate Gatlinburg
Average Price (Bedrooms 4 -6) 2020 Year End Real Estate Gatlinburg
Average Price ( Total and Bedrooms 1 -6) 2020 Year End Real Estate Gatlinburg


Days on Market

Despite the outlier in July – days on market stayed relatively close to 100 days during 2020.

Total Days on Market - Gatlinburg
Total Days on Market – Gatlinburg
Days on Market (Bedroom 1-3)
Days on Market (Bedroom 4-6)
Days on Market - Total and Bedrooms 1-6
Days on Market – Total and Bedrooms 1-6


2020 Year-End Real Estate Market Statistics

Residential

Have a look at the year-end 2020 graphs below. It’s very interesting to look at the average price and days on market correlation over the last 4 years. Days on market is flat from 2019 to 2020, after a 20% decrease in both 2017 and 2018. While the average price continues to increase by 23% from 2019 to 2020, after an increase of 11% from 2018 to 2019, and a 10% increase from 2017-2018.

Average Price 2017 - 2020
Average Price 2017 – 2020


Days on Market 2017-2020


Single Family Homes – 2020

Single Family Homes Average Sales Price vs Average List Price
Single Family Homes - Days on Market
Single Family Homes – Days on Market
Single Family Home - Average Price Per Square Foot
Single Family Home – Average Price Per Square Foot


Condos – 2020

Condo - Average Sale vs Average List Price
Condo – Average Sale vs Average List Price
Condo - Days on Market
Condo – Days on Market


Condo - Average Price per Square Foot
Condo – Average Price per Square Foot


Land

Average land prices increased year over year from 2017 – 2020; 15% 2017 – 2018, 17% 2018 – 2019, and 16% 2019 – 2020.

Land - Average Price 2017 -2020
Land – Average Price 2017 -2020


Land - Sales Price vs Listing Price
Land – Sales Price vs Listing Price


Land - Days on Market
Land – Days on Market


A look forward

“Many experts are predicting another strong housing market in 2021. They are forecasting increased demand from buyers who delayed purchasing homes because of the pandemic; from existing homeowners who need larger spaces to accommodate parents working from home and children attending school virtually; and from condo owners who are seeking to escape multifamily buildings for single-family houses to mitigate exposure to the virus. The ability to tour homes and close on purchases virtually will make buying a home simpler in 2021.”

You can read the full Washington Post article here.

Check back with us here on the first Saturday of each month to get the latest Smoky Mountain Real Estate stats. 

*Note: statistics collected using the Bluff Mountain, Chalet Village, Cobbly Nob, Douglas Lake, Gatlinburg, Jones Cove, Kodak, New Center, Pigeon Forge, Pittman Center, Sevierville, Seymour, and Wears Valley areas.

December 2020 Market Statistics

Below is the market report for December. Next week we’ll share a year-end report. The year-end report will provide yearly graphs focusing on days on market and average price.

Residential

December 2020 Real Estate Market Statistics


YTD 2020 Real Estate Market Statistics


Land

December Land Real Estate Market Statistics


Year to Date Land Real Estate Market Statistics

Top 5 U.S. Housing Market Predictions for 2021

Each year the Home Buying Institute analyzes current real estate market trends and conditions across the United States to offer a forecast for the upcoming year. This year there are lots of things to consider.

Below are the top five predictions for the 2021 real estate market.

1. Home prices will continue rising in most U.S. cities.
2. Housing market inventory will remain tight in 2021.
3. Home sales will remain steady going into next year.
4. Mortgage rates will hover around 3% next year.
5. It will be another good year for refinancing.

Click here to read the full article.

Bold Predictions about 2021 Real Estate Market

Overall, Yun said he felt confident that home prices would maintain their stability throughout the pandemic, but he did not anticipate that prices would soar, “particularly in the second half of the year.”
What might the future hold? Yun predicts that home sales could be 20 percent higher in the third and fourth quarters compared to the prior year. Additionally, he sees home sales rising more than 5 percent, possibly 10 percent, in 2021, as a vaccine becomes available and possibly leads to faster job growth with still favorable mortgage rates, which should stay near 3 percent.


Buffini said that for the next three years, as interest rates stay low per the Federal Reserve’s guidance, real estate professionals should put in extra efforts and make sales, even buying the very assets they sell.


You can read the full article here.

The Jason White Team joins Century 21 Legacy, the #1 ranked Century 21 organization in Tennessee!

The Jason White Team joins Century 21 Legacy, the #1 ranked Century 21 organization in Tennessee!


The Jason White Team, the #1 ranked Century 21 team in Tennessee, is honored to announce that as of October 22, 2020 they are now apart of Century 21 Legacy, which is the #1 ranked Century 21 real estate group in Tennessee.
Century 21 Legacy has ten offices throughout East Tennessee; two locations in Knoxville, two locations in Kingsport, Johnson City, Greeneville, Townsend, Maryville, Pigeon Forge, and Gatlinburg. The Jason White team now operates from the newly opened Century 21 Legacy office, located on Community Center Drive in the beautiful Barnes’ Insurance building in Pigeon Forge, TN.

Not only does this new partnership greatly broaden the Jason White Team’s reach, we now have access to a plethora of resources we didn’t have before, which will allow us to serve all of our current, past and future clients better.

“I am very proud and excited to join forces with Century 21 Legacy. They have for many years demonstrated their pledge to excellence by providing outstanding client service but more importantly through their dedicated commitment to embodying our state’s volunteer spirit with service to their communities through fund raising efforts and volunteer initiatives.  This is an inspiring culture for us, allowing our team to broaden our reach, serve more people and bring more support to our beloved Sevier County.” – Jason White


The Jason White Team has been serving locals, investors and second-home seekers in Sevier County, Tennessee since 1996. We’ve specialized in vacation rentals from the beginning, selling over 1300+. We know the management companies, the process, local vendors, inventory, rates of return, what works and what doesn’t. We’ve grown our team and honed our craft over the years and are now more able than ever to serve our client’s unique needs. For more information, visit www.jasonwhiteteam.com.

November 2020 Market Report

Residential

Average price has risen by 24% and by approximately $75,000 year to date.

November 2020 Residential Real Estate Market Statistics
Year to Date Residential Real Estate Market Statistics


Land

Average price in Chalet Village is up by 22% month over month.

November 2020 Land Real Estate Market Statistics


Year to Date Land Real Estate Market Statistics

Are We Facing A Housing Shortage?

There are fewer homes for sale in the U.S. today than ever recorded in data going back nearly 40 years.

“We are simply facing a housing shortage, a major housing shortage,” says Lawrence Yun, the chief economist at the National Association of Realtors which tracks home sales. “We need to build more homes. Supply is critical in the current environment.”

“Housing inventory shortages have pushed national home prices considerably higher,” says Joel Kan, vice president of economic forecasting for the Mortgage Bankers Association.

“We have been under producing for the past decade,” Yun says. “We need more construction.”

Yun had much more to say, see the full NPR article here. 

Nationally homes continue to sell more quickly than last year!

National Housing Market Data

According to Realtor.com’s Monthly Housing Market Trends Report:

  • National inventory declined by 38% over the last year.
  • Inventory of newly listing properties decline by 7% nationally.
  • The national median listing price in October was $350,000, up 12% compared to last year.
  • The typical home spent 53 days on the market this October which is 13 days less than last year, and one day less than last month.

Forbes reports,  “For the first time since 2011, homes sold faster in October than September and prices remained at their summer peak of $350,000.”
Realtor.com®’s October housing data release reveals that sellers returned to the market, as the decline in newly listed properties substantially improved…While the national price growth rate continued to accelerate to historical highs, larger metros saw a slight softening, signalling a small reprieve for buyers in this active autumnal season.”